Skretting sustainability report 2020

Our migration towards a more sustainable future

The carbon footprint of feed

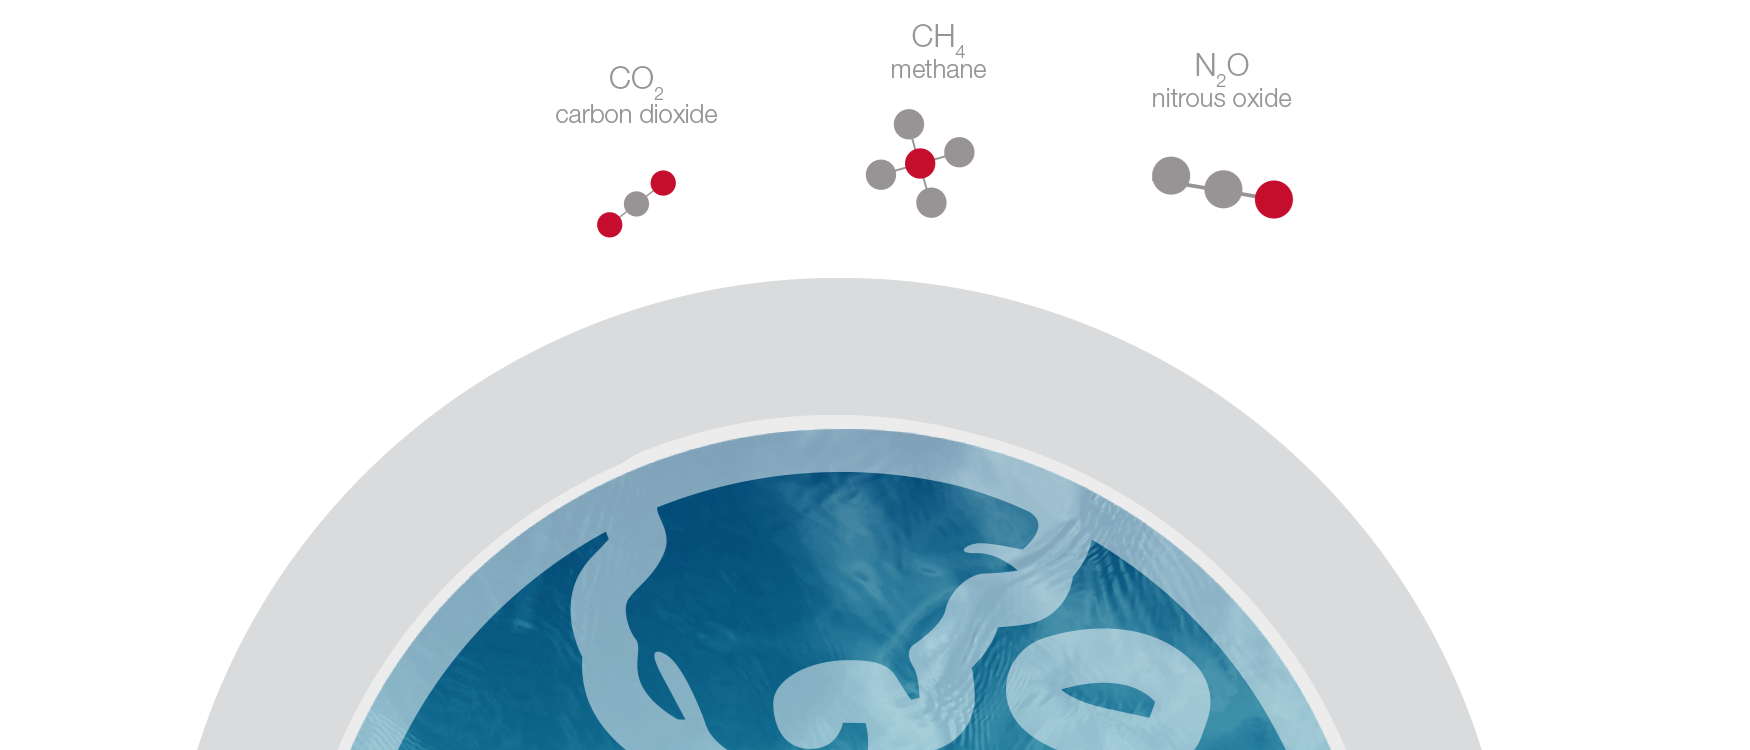
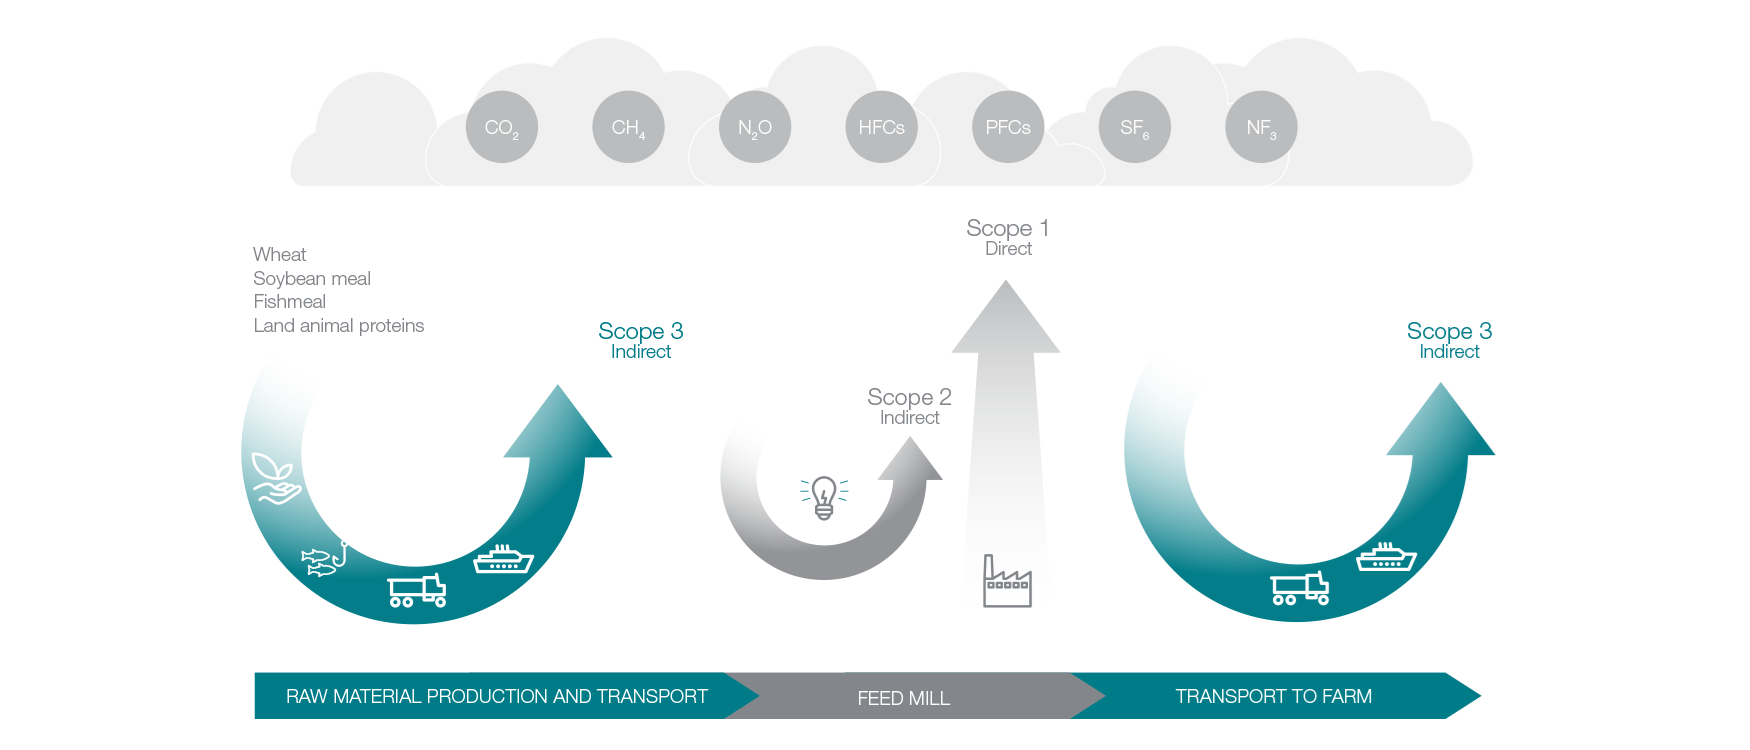
A carbon footprint considers the life cycle GHGe of products and services. The International Organization for Standardization (ISO) carbon footprint standard, ISO 14067:2018, defines this as the sum of greenhouse gases (GHGs) and (natural) GHG removals in a product system, expressed as CO2 equivalents (CO2e) and based on life cycle assessment (LCA) principles using the single impact category of climate change. As such, all life cycle stages are considered in terms of a carbon footprint – from resource extraction, manufacturing and use, through to disposal or recycling. A partial carbon footprint, meanwhile, only considers selected life cycle stages.

The key difference to an LCA is that a carbon footprint study assesses only a single environmental impact category (global warming potential), and not other potential environmental impacts, such as non-GHG emissions, acidification, eutrophication, toxicity, biodiversity. As with LCAs, carbon footprint does not address social or economic impacts.

Cloudy sky

Greenhouse gases

Greenhouse gases (GHGs) are gases that contribute to global warming by absorbing and emitting infrared radiation. There are many different gases classified as GHGs (both natural and caused by human activity) which, when released into the atmosphere, contribute to climate change. The most prominent GHGs are carbon dioxide (CO2), methane (CH4) and nitrous oxide (N2O).

In the context of LCAs, the focus is on the GHGs arising from human activity as listed in the Kyoto Protocol (see figure 1). The unit of measurement considering GHGs as a sum parameter and thus for a carbon footprint is carbon dioxide equivalents (CO2e).

The most prominent GHGs are:

Carbon footprint graphic

Scope 1, 2 and 3 emissions

Scope 1: All direct GHGe that come from sources that are owned or controlled by the Skretting. Typical examples are machines and equipment that uses oil and gas in our factories.

Scope 2: Indirect GHGe from consumption of purchased energy like electricity, heat or steam. The energy here is generated outside our factories, but transported to our factories as energy.

Scope 3: Other indirect GHGe, such as those related to the extraction and production of purchased materials and fuels, transport-related activities in vehicles not owned or controlled by Skretting. In the context of our business, the majority of Scope 3 emissions are related to the cultivation, manufacturing and transport of feed ingredients. Scope 3 emissions contribute most to the overall emissions of feed products.

GHG graphic
Adapted from GHG Protocol

Allocation of emissions

When calculating a product’s carbon footprint, the different life cycle stages and production processes need to be considered. However, many processes result in different outputs or products. One simple example of this is a soy processer that produces soybean meal, soy oil or soy protein concentrate. In such cases, the carbon footprint related to the process inputs (such as the soybeans) but also the process-related emissions need to be allocated to the different process outputs.

There are different principles on how to do this allocation, for example physical allocation (often based on mass shares of the outputs), energy allocation (for example based on the calorific contents of the outputs), or economic allocation (based on the values of the outputs). All come with advantages and disadvantages. According to the core LCA standards, where allocation cannot be avoided, physical allocation is the preferred option due to its robustness. However, a physical allocation often attributes a higher share of the emissions to by-products, which seemingly contradicts the intention to utilise by-products to enhance a circular economy. Thus, ISO gives the option to select other allocation types when this can be justified. The economic allocation is defined as the preferred option for feed ingredients by the European Product Environmental Footprint (PEF) standard, in particular the PEF Category Rules for Feed as a relevant industry standard.

Calculating the footprint of a product

Calculating the footprint of a product graphic

Direct land use change

The carbon footprint of a feed product should be declared considering direct land use change as required by the accepted international carbon footprint standards. Direct land use change mostly refers to the conversion of non-agricultural land to agricultural land following, for example, an increased market demand for an agricultural commodity. This conversion will result in short-term and long-term GHGe (due to biomass loss but perhaps also due to a long-term adaptation of the soil carbon pool until it reaches a new equilibrium).

Greenhouse gas emissions related to direct land use change have to be considered when the land use change happened within the past 20 years prior to the assessment. This means, when it can be demonstrated that ingredients are sourced from land that had been transformed 20 years prior to the assessment, no emissions from direct land use change need to be considered in the carbon footprint study.

When ingredients are sourced from land that had been transformed into agricultural land 20 years prior to the assessment, no emissions from direct land use change need to be considered in the carbon footprint study

Understanding carbon footprint values

To understand and compare the carbon footprints of different feed products it is important to fully understand the methodology being used. It should also be validated if the core requirements by the accepted and industry-relevant LCA standards are met (for example the requirements on including land use change emissions and selection, data quality or allocation principles). Otherwise, it will not be possible to compare like for like.

An example of these standards is the PEFCR Feed for Food Producing Animals.

Understanding carbon footprint graphic

1

That direct Land Use Change (LUC) is included tells us that the carbon footprint also includes the greenhouse gas emissions (GHG) related to land use change like e.g., deforestation which has happened within the last 20 years and is mainly linked to the agricultural feed raw materials

2

When GHG emissions are stated using mass allocation, Canada has a much higher value than Norway. A closer analysis would reveal that this is mainly due to the use of poultry by-products in the feed. A mass based allocation attributes higher footprint shares to by-products when they have a higher mass e.g. compared to the main product, although they might come with a much lower economic value. Also, the processing of raw materials will often lead to increased energy use and hence, potentially a higher GHG emission

3

When GHG emissions are stated using economic allocation, Canada has a much lower value than Norway. A closer analysis would reveal that this is mainly due to the use of poultry by-products in the feed. Using economic allocation respects the lower value of poultry by-products

4

CO2e/kg feed means carbon dioxide equivalents – indicating that the global warming potential of all green house gases have been considered and not only e.g. carbon dioxide


In this section

The carbon footprint of feed
Improving our own operations
Skretting Italy initiates carbon neutral opportunities
Our new soy sourcing policy
A better-defined stance on novel ingredient sourcing and application
Advocating for a responsible blue whiting fishery