
Scopes 1 & 2 - Improving our own operations
To achieve our Science Based Targets commitment, and grow at the same time, Skretting needs to take every single opportunity for CO2e reduction – improving energy efficiency, switching to alternative, less polluting fuel sources, and purchasing renewable electricity wherever is possible.
Year of consolidation and the first results
2021 was a year of consolidation of our systems and practices, and a year of the first results. From the global point of view, we improved our data analytics, developed several dashboards which allow us to address, measure and monitor progress during this sustainability journey. In collaboration with an external company we mapped the energy savings potential of our sites and identified actions that need to be done. All Skretting operating companies had high focus on energy efficiency in 2021. Plants were busy executing energy efficiency projects, achieving their specific energy reduction targets and lifting the sustainability awareness among all employees. We are proud to share that 70% of our sites reduced kWh/t compared to 2020. This result is a good progress considering how tough 2021 was for production, when it comes to raw material quality, pandemic, energy crisis and delays in supply chain.
As a result of continuous work on energy savings and switching to green energy sources 87% of Skretting plants reduced kg CO2e/t.
From the global point of view, we improved our data analytics, developed several dashboards which allow us to address, measure and monitor progress during this sustainability journey.
Challenge with absolute reduction
Despite all efforts, we had a significant increase of absolute CO2e in Scope 1 & 2 in 2021. This was a wakeup call and helped us to understand how difficult the task in front of us will be. The increase mainly came from the huge growth that we have had in some regions where we have poor availability of renewable energy sources. We are committed to our purpose of Feeding the Future and growth of high-quality protein food is a part of it. This means that our volumes will keep growing as well as our energy consumption. We will use green(er) fuel sources where available, but there are still regions where we don’t have stable or available green alternatives. In years to come we will evaluate if any technological advancement will help us to achieve our targets. Until then, we are set on our path of improving our own operations and reducing CO2e by conventional methods: improving energy efficiency, using renewables, setting Power Purchase Agreements (PPAs) and buying Energy AttributeCertificates (EACs).
Learn more
Skretting Chile’s journey towards reduced CO2 emissions
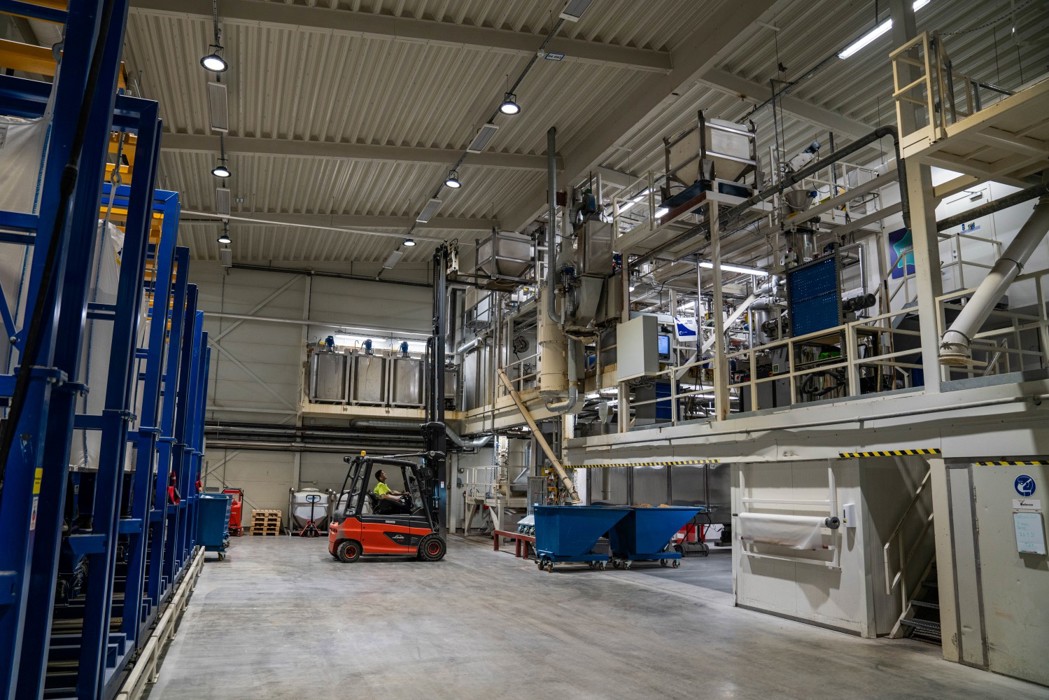
 Skretting Chile accomplished several milestones in terms of sustainability and energy efficiency, in line with the Nutreco’s Sustainability RoadMap 2025 and requirements for ISO 50001 certification at the national level. Highly competent and motivated colleagues from Chile have built an impressive culture of continuous improvement and sustainability.
Skretting Chile made a leap towards less CO2e emission by establishing a green electricity supply agreement from Statkraft, with zero negative impact on the environment in both plants. The agreement has started in 2021 and covers the electricity demand of Chilean operations until 2024, guaranteeing a significant drop in the CO2e. Improvement in energy management systems and energy monitoring is a prerequisite for ISO 50001 certification. Mapping of energy consumption of all areas of production will enable the Chilean team to closely monitor consumption and measure improvements. Also, during the last year, a series of modernisation and changes were made in machines and motors used in the plants, replacing them with high energy efficiency motors. Diverse initiatives to lower energy consumption were completed, like installation of steam traps, insulation of steam valves, adjustment of fans speed, air compressor improvement, dryer optimisation, installation of photocells to control light intensity in the plant, etc.
Álvaro Cifuentes, Supply Chain Manager at Skretting Chile, points out: “Sustainability is essential, both in our plants and throughout entire supply chain. For us it is unthinkable to have operations that do not consider sustainability. The myth that it is more expensive to produce sustainably has also been demolished. Being efficient, means less cost and less pollution. This is a new norm that is already incorporated in our culture. Sustainability is no longer a slogan or a marketing action, but it is the minimum standard”.
Operational excellence
Operational excellence (OE) is the Nutreco wide program launched during 2021, with the ultimate goal to build a culture of continuous improvement in all our factories. OE provides a system to identify, reduce and eliminate losses permanently, through the active participation of all employees of the organisation. The Nutreco OE program will be introduced in waves, so not every location at the same time, but eventually all sites will be covered.
Three Skretting OpCos were pioneers in the first wave of the OE program. A broad range of projects have been initiated in Skretting plants in Chile, Ecuador and Vancouver, to lift the performance of our factories when it comes to productivity, energy efficiency and autonomous maintenance. The main focus last year was on training our people by external experts in this field, as well as internal knowledge sharing among those participating in the program. Project teams were introduced and trained to use a wide range of problem solving methodologies such as PCDA (Plan, Check, Do, Act), 5W+2H (5 Whys and 2 Hows), 5S, etc. The idea was to
get all employees equipped with a set of skills and tools to identify and implement improvement opportunities in our processes on a day-to-day basis. This will eventually establish a structured way to problem solve and eliminate losses in our processes. It can be challenging to engage already busy production workers into OE activities but by empowering production workers, they can eventually save time and make their working life better and safer. Global teams will provide support to help our colleagues to adapt to this new way of working.
Last but not least, excellency in our operations will help Skretting to improve efficiency while still operating in a safe, sustainable and socially responsible manner.
In 2022, four more Skretting sites will join the OE program.
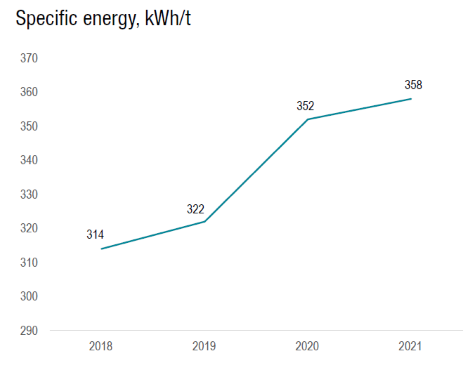
Production KPIs
Specific energy consumption - kWh/t: + 1.6 %
Even though most of our plants reduced the amount of energy used per ton of feed compared to 2020, overall average of Skretting increased by 1.6%. We are happy to see the improvement compared to last year where we had a 6% increase. We will continue energy efficiency projects and try to reverse the trend in 2022.
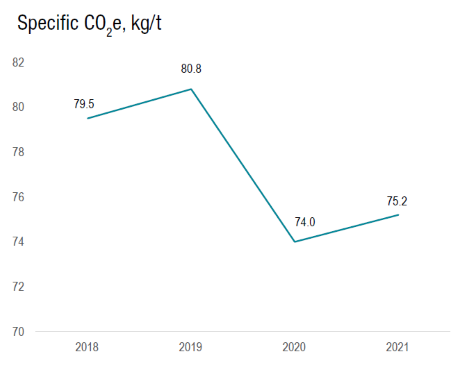
GHG emissions kg CO2e/t: + 1.6%
Last year we observed an increase in GHG emissions. A few changes that will contribute to a reduction were implemented towards the end of the year and were not accounted in 2021 results. Those changes, together with the new green initiatives in Skretting will be reflected in 2022 result.
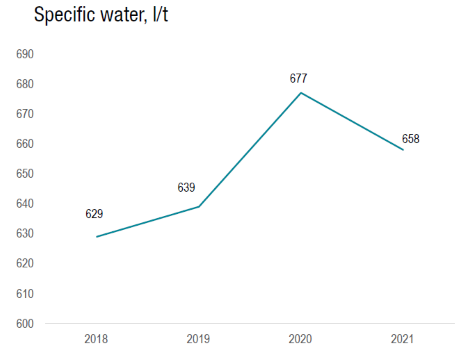
Water l/t: -2.7%
In 2021 we registered a decrease in water withdrawal of 2.7%. Overall, we see that plants are focused on reduction of process water consumption, which will at the same time reduce energy needed for drying. This year, some plants also improved their measurement systems which helps us to get a better picture of our water consumption.
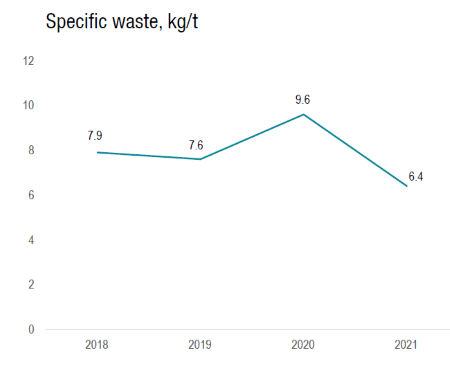
Waste kg/t: -33.6%
Waste amount varies a lot from year to year because it depends on many factors like construction projects, cleaning activities, change of raw material delivery from small bags to bulk and so on. Last year Skretting disposed 33 % less waste than in 2020.

Scope 3 – Addressing the emissions beyond our operations
Comparability by reduced flexibility - The need for following the standards.
LCA is a method that can basically be applied within every sector and for every existing product. The generalISO standards for LCA define the general steps of the method and basic requirements for communication and comparison, but do not guide specifically on calculation rules for specific sectors or products. This allows for a rather high degree of freedom when performing LCA’s according to only the general ISO 14040/44 standards, for example regarding which secondary data to choose, what to exclude from the system boundary, or how to allocate the environmental impacts between products and by-products.
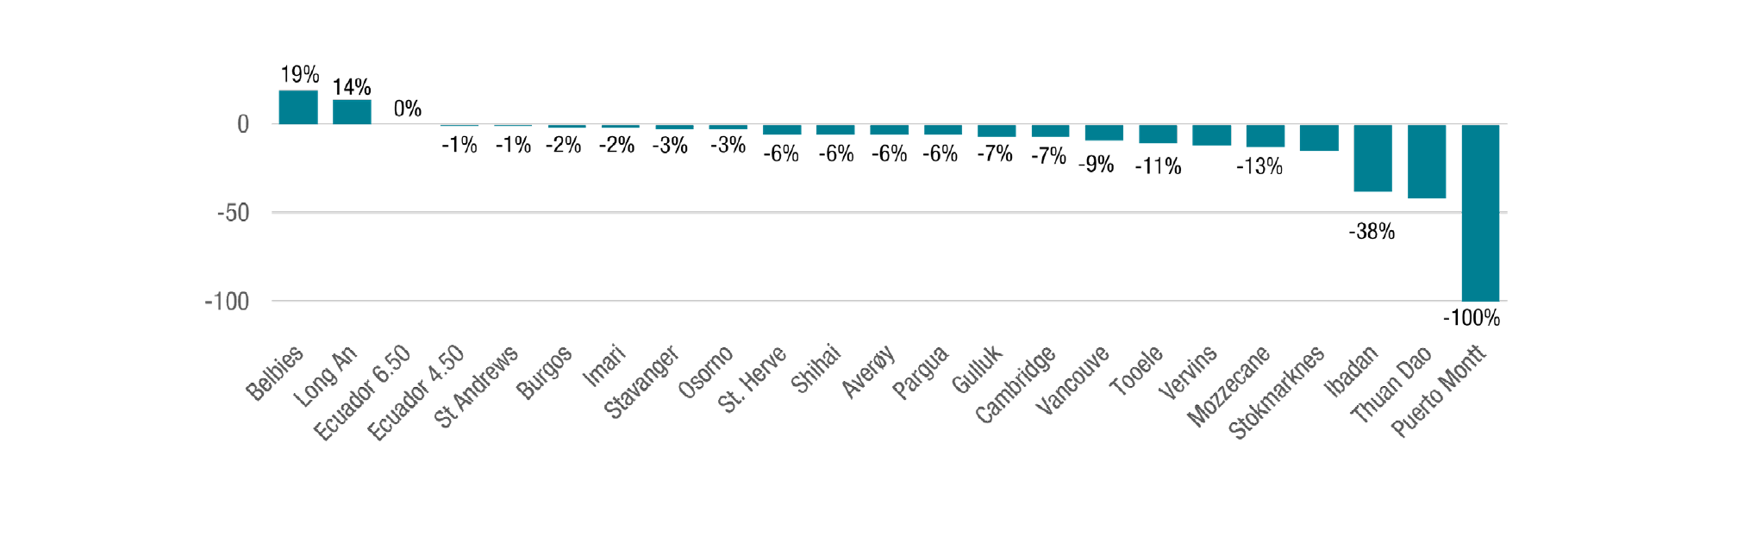
This given flexibility reduces the comparability of footprint values as even for the same products from the same producers significantly different footprints may be calculated depending on the methodological choices made by the LCA practitioner. This is shown in the example below, where only the specific choices for two (out of many)methodological aspects of an LCA results in four quite significantly different carbon footprint values for the same products (in this case a salmon feed produced in Norway and a different Salmon feed produced in Canada).
With footprint metrics becoming increasingly important, for example as additional procurement criteria, following the same calculation rules/ standards is crucial to create a fair competition.
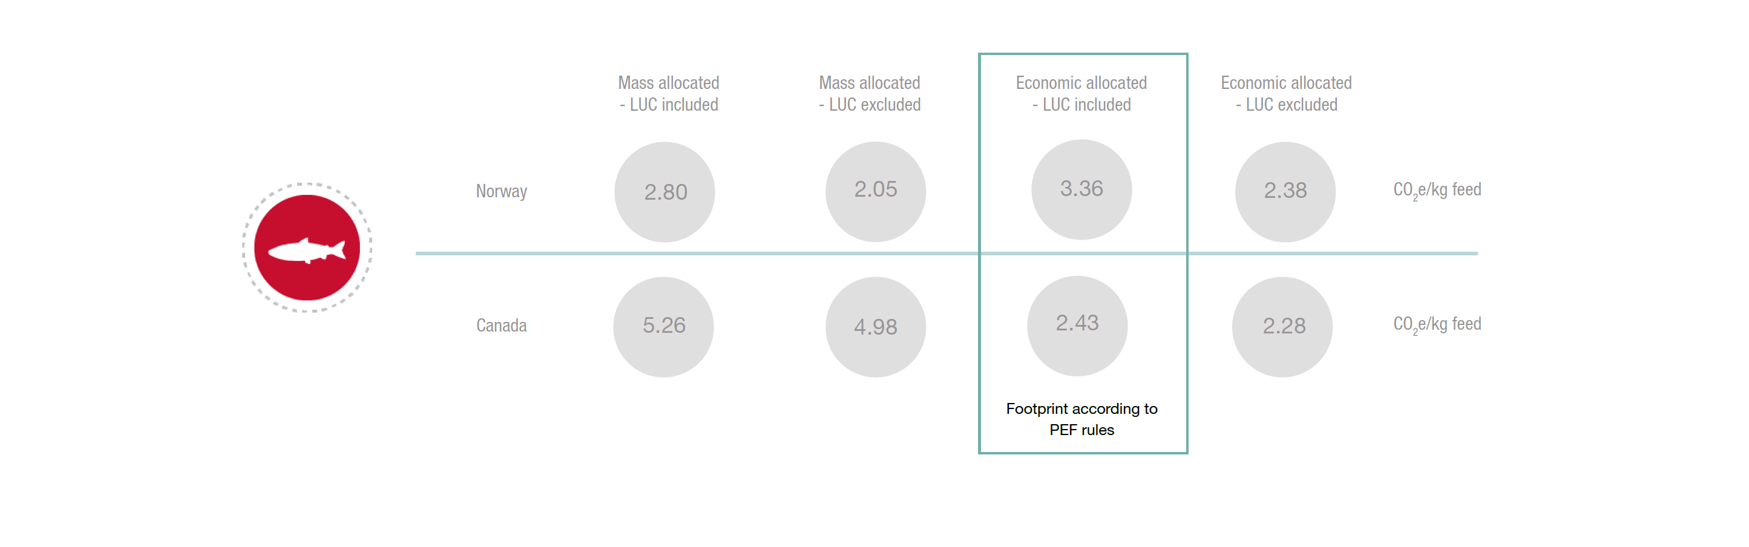
The European Product Environmental Footprint (PEF) initiative tries to address in particular this topic and aims for “increasing comparability by reduced flexibility” of LCA calculations. Under this framework, specific so called PEF Category Rules were and still are developed, defining core calculation principles for specific product groups.
Such PEF Category Rules are existing for Feed for food producing animals. Skretting welcomes this industry specific standard as it gives more clarity to us but also to our customers on how the footprint of feed has to be calculated. That is why we are generally following the guidance given by this standard. Coming back to the example, the PEF standard for example highlights that economic allocation is mandatory for feed ingredients. It also requires direct land use change to be taken into account and reported separately.
Learn more
Farmer’s perspective: Cermaq, climate change, and feed
 Cermaq Group AS is a leading global producer of aquaculture salmonids. With a headquarters in Oslo, Norway, Cermaq has operations in Chile, Canada and Norway and sales around the world.
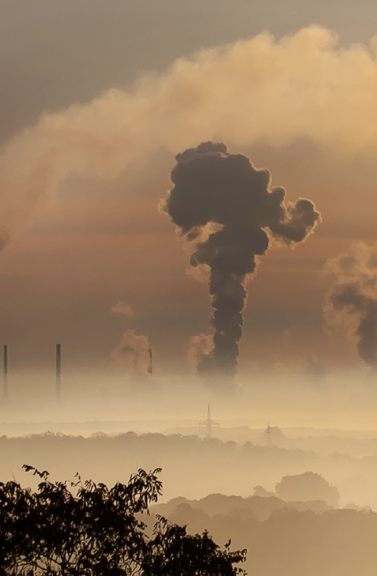
With the continuing increased importance of combatting climate change and mitigating risks associated with higher temperatures, rising sea levels, and increasing extreme weather, Cermaq has identified UN Sustainable Development Goal 13: Climate Action as being a key part of our sustainability strategy.
One of Cermaq’s key actions against climate change is a reduction of the carbon dioxide emissions from its own operations and from its value chain. Cermaq has set a goal to reduce 35% of overall emissions versus a base year of 2019 by 2030 in line with requirements published by the Science Based Targets Initiative based on the Greenhouse Gas Protocol.
In order to set our Science-Based Climate Targets, Cermaq created an inventory of all climate gas emissions in its own operations and its value chain using methodology published by the Greenhouse Gas Protocol. For Cermaq, the emissions from feed ingredients and production are the highest source of emissions in our value chain. Therefore, understanding of the emissions from our feed is crucial both to setting a climate emissions target and to achieving that climate target. In particular, tracking and reporting the emissions from feed producers on an annual basis is a key part of Cermaq’s climate reporting, and reducing the emissions from feed will be a primary driver of Cermaq’s overall emissions reductions.
It is also important that feed suppliers use transparent and standardised reporting methods in order to allow companies purchasing feed to be able to compare the carbon emissions footprints of different suppliers of feed. Nowadays, there are some challenges connected to the emission calculations and for this reason, we believe it is vital to work hand in hand with the feed suppliers to understand the data and set strategies to mitigate the Carbon footprint levels from cradle to farm. Cermaq is happy that we are able to collaborate with our feed suppliers to build clearer and more responsive climate reporting systems that will allow transition of both aquaculture companies and their suppliers to a low-carbon future.
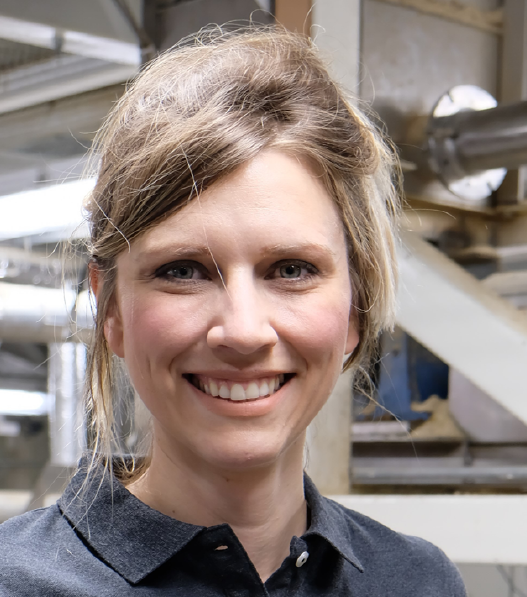
Daniel Pescatore, Sustainability Analyst, Cermaq Group
The use of primary versus secondary data
Even when following the PEF standard, there is still room for flexibility, and we experience that this still can lead to non-comparable footprint values. One challenge is the use of supplier specific footprint data as there are vastly missing guidelines on to be applied quality criteria for these. More supplier specific data is urgently needed as secondary datasets are averages and thus do not allow to identify supplier specific processes and limit ability to engage with specific suppliers or to identify those with lower footprints.
We started to actively engage our core suppliers to provide more specific footprint data, starting with the ones we have gaps in the LCA databases and the ingredients driving most our footprints (for example, soy). However, before we are taking any supplier value into our calculations, we check these values on their quality and alignment with the basic requirements according to the PEFCR Feed standard for consistency reasons.
Currently, we do not receive many supplier specific footprint data aligned with these calculation rules. We also see difficulties for our suppliers calculating according to these feed specific requirements when they are also delivering the same products to other industry sectors with different calculation requirements or when they still don’t have experience in footprint calculations. We want to bring these topics onto the discussion tables of the pre-competitive working groups we are in, as we think it is a topic to be addressed by the industry in general and it cannot be solved by single companies. At the same time we need to define clear and transparent rules when it comes to primary data, in order to further
increase comparability.
The value of suppliers contributing with primary data: ProTerra’s case
 In Europe data on carbon footprint and LCA is becoming more relevant for feed production, in certain countries it is already obligatory to deliver this data. Life Cycle Assessment (LCA) based methods are widely used to deliver accurate, quantified clear information on environmental, social or economic impacts of products helping in the decision-making process. In Europe, a big initiative took place in 2013, called Product Environmental Footprint (PEF) with the goal to create a “Single Market for Green Products” offering a standard for impact assessment of products and organisations, creating and testing rules recommended set of methods from among the huge number of available options, thus enhancing transparency and fair competition.
More and more transparency about Environmental, Social and Governance (ESG) aspects of companies and value chains are required. Good practices such as Life Cycle Management (LCM) have a great potential to reduce risks and increase competitiveness. In the environmental pillar, climate change adaptation and mitigation are part of a global agenda guided by Paris Agreement commitments defined by governments.
The challenge
Environmental indicators are not collected in a structured way, and this can lead to confusion and even differing results for the same products depending on the applied methodology.
The current system is unfair towards organisations that invest in sustainably produced and land conversion free raw materials, because the twenty years period cannot be proven in most cases (due to cut-off dates, low resolution, costs or non-existing data).
The ProTerra standard is a deforestation free standard with a cut-off date of 2008. That means we cannot guarantee LUC free areas for 20 years and primary data is required to be able to show that the crops produced under the standard have better figures than non-certified crops (mainly soy and sugarcane).
Over the years, the ProTerra Foundation has made many improvements to meet these new environmental impact requirements for agricultural raw materials, including the inclusion of traceable data, starting with the carbon footprint indicator of soy-derived products.
The ProTerra Foundation, in partnership with external experts, developed a tool to calculate GHG emissions, comprising methods to estimate land use change (LUC) and the resulting GHG rates. The main objective of this project is to differentiate from non-certified products by providing buyers with ProTerra-specific data for the calculation of GHG. The results of this project can be found here.
Before ProTerra implementation of the Carbon Footprint calculator, members have been forced to calculate CF using default data, which, in most cases, creates a disadvantage for them. Now, certified organisations that invest in sustainably produced are able to inform specific data, but still face big challenges for producing evidence on land transition pathways in a 20-year period. ProTerra updated the results in 2021 with the aim to analyse the environmental footprint of the ProTerra Standard certified soybean and soybean meal and oil. The environmental impact categories in scope were carbon footprint, water consumption and land use. The environmental footprint included the following life cycle stages: soybean cultivation, transport from farm to crusher, soybean crushing and transport to the European market.
Conclusion
It’s known that results may vary depending on real sourcing data of a specific crusher and the region of origination. While ProTerra is working on collecting and systematizing data, some small adjustments can be done in the presented calibration results in order to create an average profile for ProTerra. From the analysis it can be concluded that the availability of more high-quality (primary) data is crucial to make more accurate calculations. In order to be able to make claims, company-specific data should be used instead of secondary data from LCA databases.
Based on market demand, we will continue to establish and improve such projects every year and work together with organisations such as GFLI to unify the used databases and improve LCA calculations.
Emese van Maanen, Managing Director, ProTerra Foundation
Is it enough to just focus on reducing the footprint of the feed?
The main focus over the next years will be on the carbon footprint as climate change is the most urgent environmental challenge high on the political agenda. However, we have also started to implement other impact
metrics into our database and systems which allows us to identify potential burden shifts of any carbon reduction measures.
Following the multi-impact approach LCA, we want to avoid that any long-term strategies, for example our procurement, lowers the carbon footprint at the cost of other environmental impacts such as significantly
increasing the water footprint or eutrophication impacts. This is not an easy balance, as sometimes difficult decisions based on value choices need to be carefully made, which cannot be solved by science (for example, if it
is better to accept such a higher water footprint for a significantly lower carbon footprint and to what extent). We gladly address these challenges and value choices on a pre-competitive level with our suppliers, competitors and customers, as this is nothing we can solve alone.
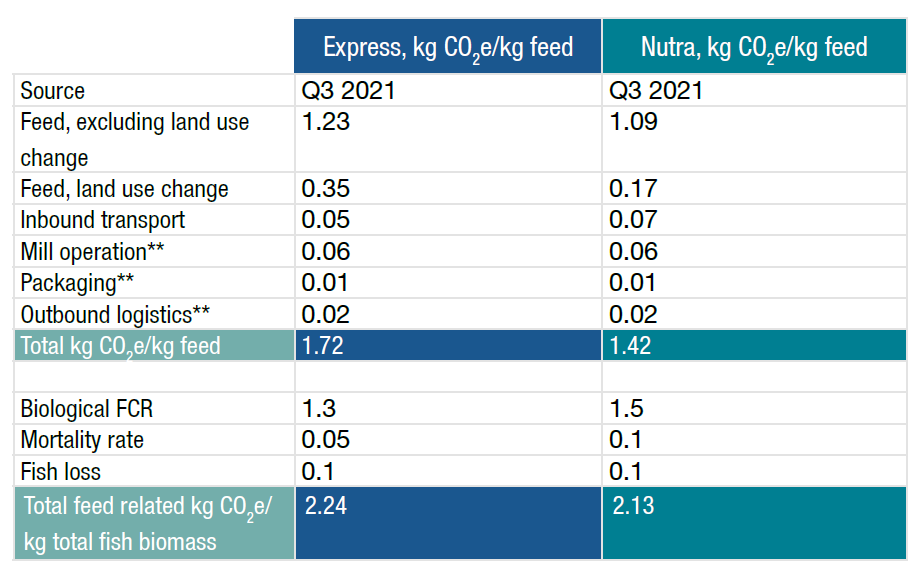
Although we have made good progress in implementing LCA and learning about our hotspots, we also face another challenge following the life cycle thinking principle. At the moment, we are primarily asked about our product footprint, and we are asking our suppliers about their product footprints. Our calculations thus mostly focus on a cradle-to-gate level and not on the full life cycle including feed-related impacts on-farm. Sometimes a higher footprint of the feed can even lead to a lower overall footprint of the fish/shrimp, for example when the quality of the feed is significantly improved and lowers the mortality or FCR.
Comparison of carbon footprint between Express salmon feed vs Nutra salmon feed
Skretting Latin America - Comparing the use of Skretting 360+ and shrimp extruded feed between 2020 and 2021
Over the years, shrimp feeding methods have evolved according to newly available technologies, and focusing on efficiency and precision farming. For effective shrimp feeding the use of automatic feeders is recommended, because the feed can be regularly and effectively dispensed in measured quantities above the water to cover a larger area, ensuring the shrimp receive the right amount of food at the right time.
Compared with manual feeding. using automatic feeders has shown direct benefits, such as better feed conversion ratio (FCR), specific growth rate (SGR), reduced dependence on labour, continuous operation, uniform growth in the ponds and achieving an improved balance with the surrounding environment due to reduced nutrient losses.
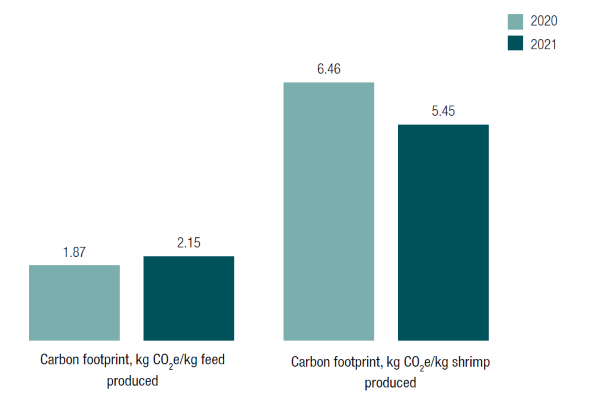
Due to the optimisation and improvement using automatic feeders, the following practical example highlights again the importance of considering the whole life cycle when making choices based on footprints, while other tools can also help to reduce the overall footprint. For a customer in Ecuador, we have calculated the carbon footprint of a shrimp feed produced in 2020 and again in 2021. At the same time, the Skretting 360+ programme was implemented on the farm, which is a multi-faceted tool for precision farming aiming at improving especially the feeding efficiency.
The calculated shrimp feed carbon footprint in 2021 was higher compared to 2020. The main cause has been that more soybean meal from South America was included in 2021, which is linked to a general high average carbon footprint related to land use change (despite being certified, as explained in section above). The calculated higher feed footprint is likely a calculation artefact impacted by not having more precise primary data and thus the need to fall back on average secondary data.
However, despite this higher feed footprint, the shrimp related footprint per kg shrimp produced was around 16% lower than in 2020. This is due to lower fish mortality and FCR, both related to the implementation of Skretting 360+.
The example demonstrates that several tools and strategies can help to reduce the footprint across the fish/shrimp value chain. As there is no single golden way, we strive to include several tools and strategies that help to further reduce the footprint of fish/shrimp and not only for the feed. Having established a good foundation for cradle-togate assessments, we want to further collaborate with our customers to develop and implement footprint tools that allow for dynamic calculations over the whole life cycle. We believe that understanding the footprint drivers of the whole value chain and their interaction is the basis to identify the most efficient strategies collaboratively. This will help our customers, us and finally the consumers to drive real sustainable solutions.
Carbon footprint per shrimp feed and feed-related carbon footprint per kg shrimp produced before and after introducing Skretting 360+.

Next
Responsible sourcing
Sourcing raw materials in a feed company is result of joint efforts from the innovation, formulation and operations teams to define the nutritional requirements and physical characteristics required by the fish or shrimp. When these parameters are defined, the procurement team undertakes availability and cost analysis based on the characteristics certain ingredients provide.