Actuals
'Actuals' module is useful for registering actual production data and keeping overview of the whole production cycle.

This module provides clear overview of the actual production performance and users could also easily compare actual data with simulation prognosis. There are 11 types of actuals graphs: last actuals, temperature & growth, daily feed amount, FCI, RGI, RFI, mortality, number of losses, biomass, tide table and moon phase.
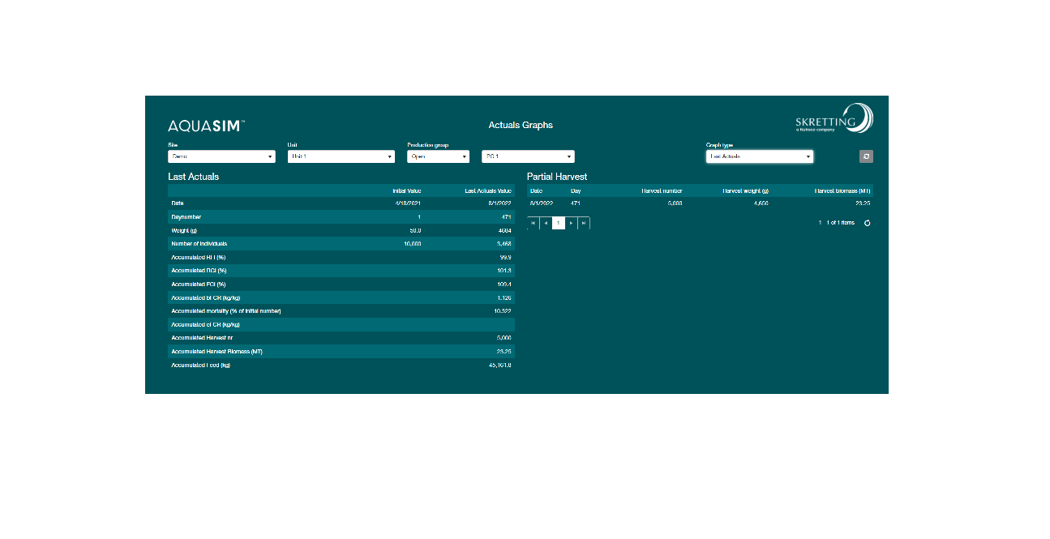
This graph has two tables. To the left, there are the numbers based on the last actual input. Accumulated eFCR will be shown when the production group is closed. To the right, there is the partial harvest table which contains all the (partial) harvest information in the whole production cycle.
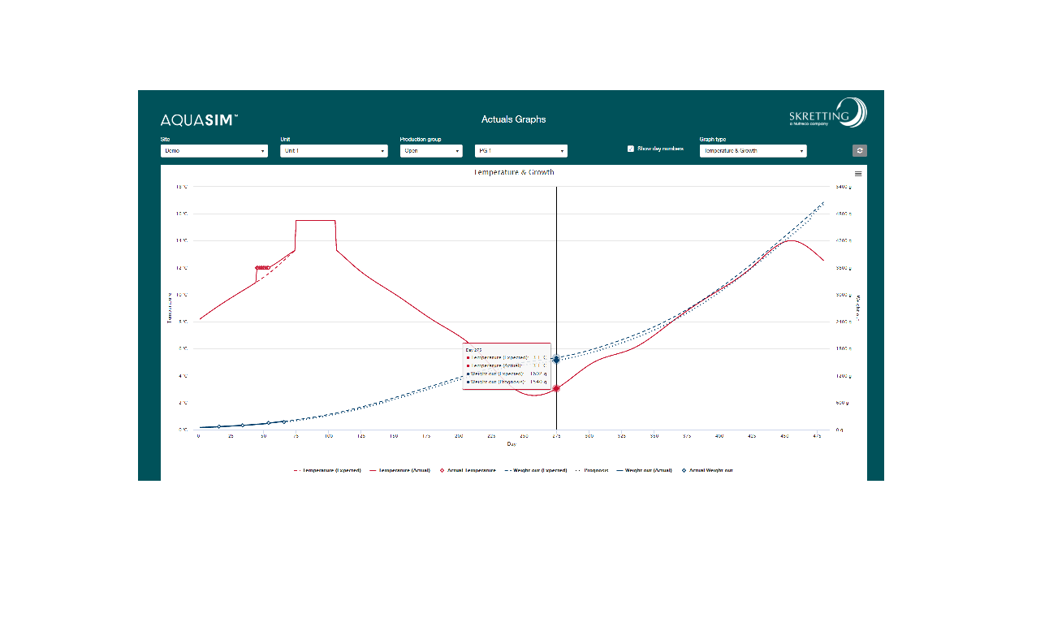
In temperature & growth graph, temperature (expected) uses the temperature data from updated simulation, and each actual temperature input will be shown as the diamond. Temperature (actual) is the line connecting all actual temperature diamonds. With each actual temperature, the temperature (actual) will gradually move back to temperature (expected) in 21 days. In a similar way, weight out (expected) uses the weight data from updated simulation, actual weight out are the diamonds and weight out (actual) connects the diamonds. The prognosis is based on the actual weight input, and takes feed RGI and FCI and all updated simulation inputs into account. So it is very important to provide correct input in the Simulation module.
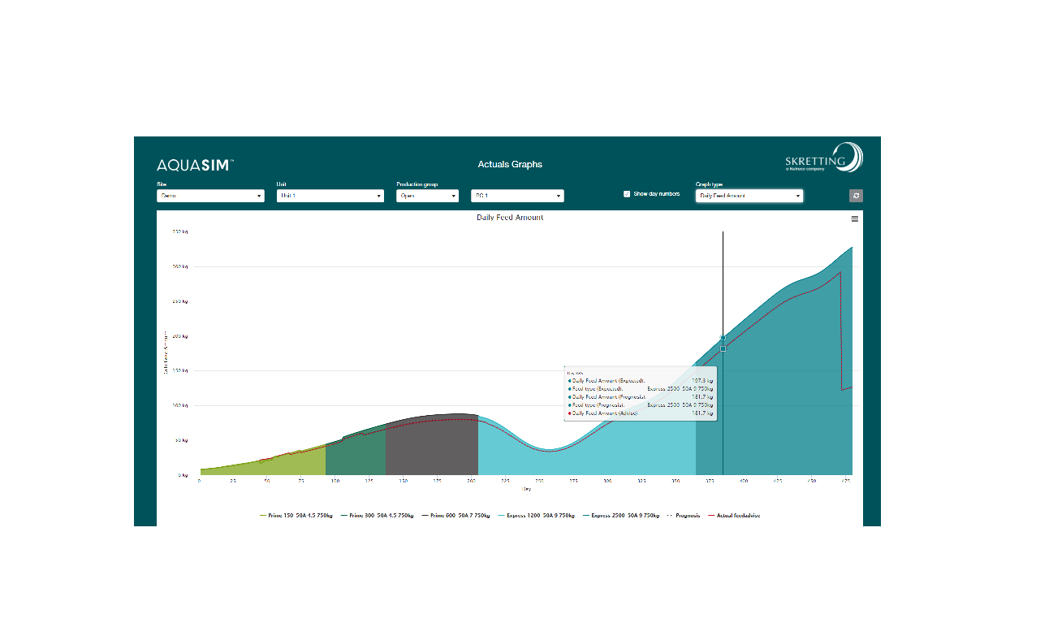
Daily feed amount graph shows the feed amount data from updated simulation in the coloured area for each feed, while the actual data of daily feed amount is presented in coloured solid line. Actual feed advice shows feed amount recommendation based on last actual data input, and the prognosis shows the prognosis of feed amount in the future taking into account expected biomass growth based on last actual inputs. Remember to put 0 to actual feed amount in the Actuals module if no feed is given to the animals.
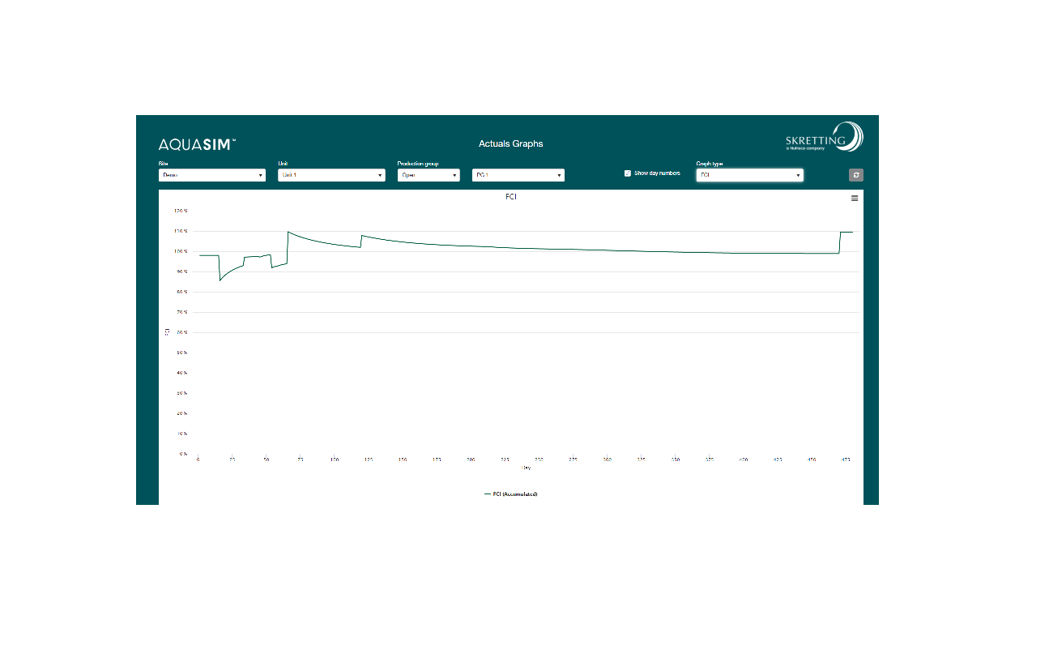
FCI graph shows accumulated FCI from day one until the end of the production cycle. FCI stands for feed conversion index, which is actual feed conversion divided by expected feed conversion. Expected feed conversion uses the base model without the adjustments of target FCR in Mysite or FCI simulation, but it takes actual temperature and other environmental parameters into account. In this way, you can benchmark different production groups.
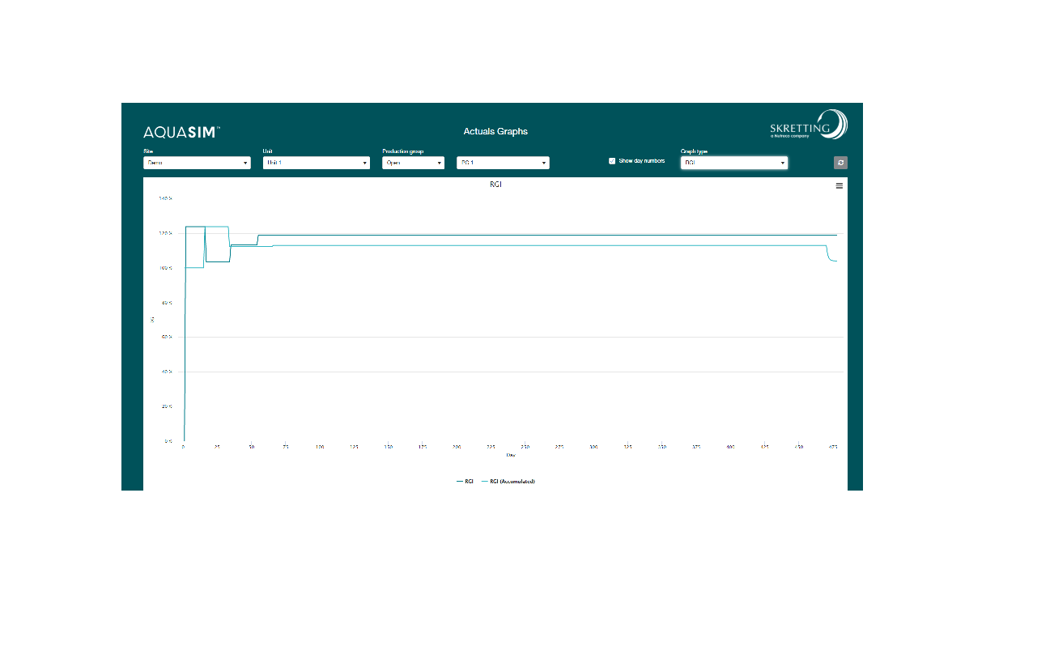
RGI graph shows RGI and accumulated RGI. RGI stands for relative growth index, which is actual growth divided by expected growth. Expected growth uses the base model without the adjustment of feed RGI and FCI or simulation, but it takes actual temperature and other environmental parameters into account. No RGI graph will show if there is no actual weight input.
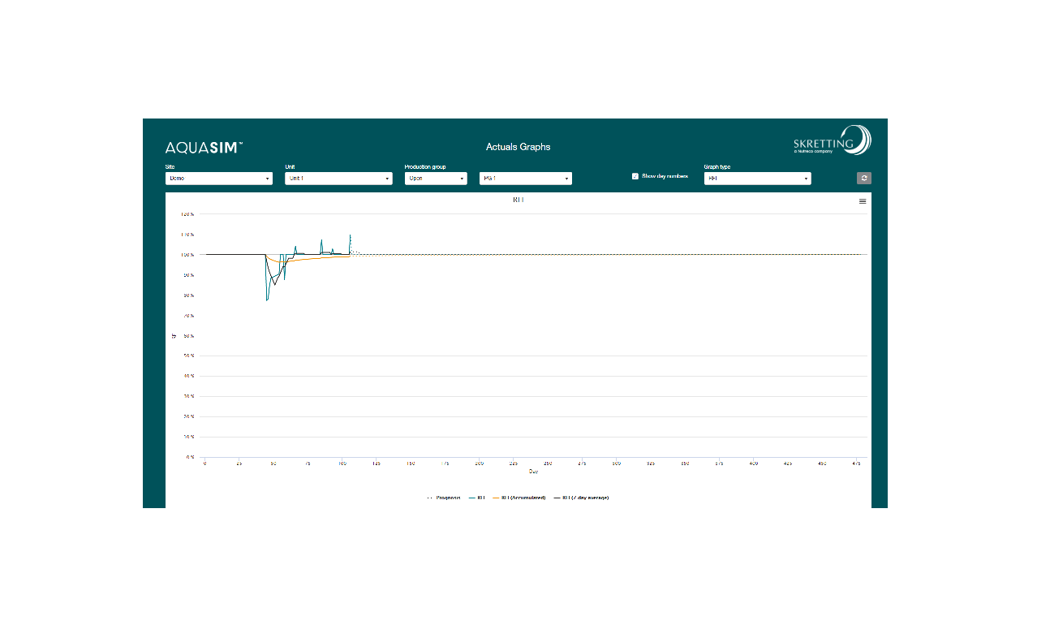
RFI graph shows RFI and accumulated RFI. RFI stands for relative feeding index, which is actual daily feed amount divided by expected daily feed amount. RFI is a good way to check if you’re overfeeding or underfeeding. In general, there is an optimal feeding amount where animals are absolutely full. So if they're fed less than the optimal feeding amount, they're being underfed, and could have grown more if fed more; in contrast, when you're overfeeding the animals, you're using more feed, but the animals will not grow more.
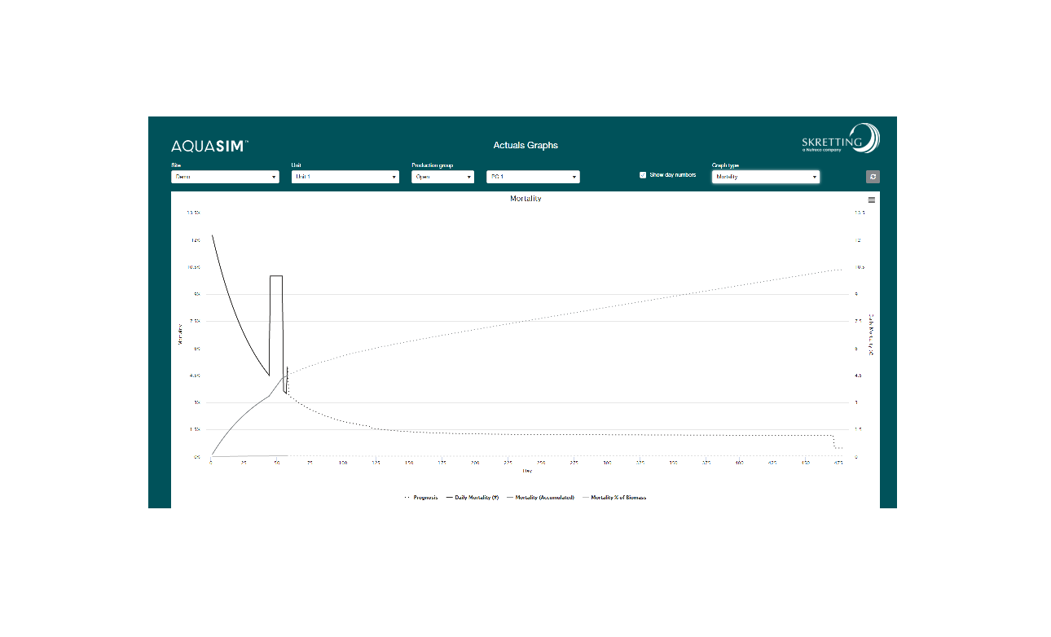
Mortality graph shows the actual mortality data. When there is no actuals, it will use the mortality data from updated simulation. So if you're counting mortality every other day and add actuals to Actuals module, make sure to put zero to the days that you're not counting mortality. Else, the mortality number will be wrong as AquaSim will use the expected value from updated simulation. Prognosis uses the mortality data from updated simulation.
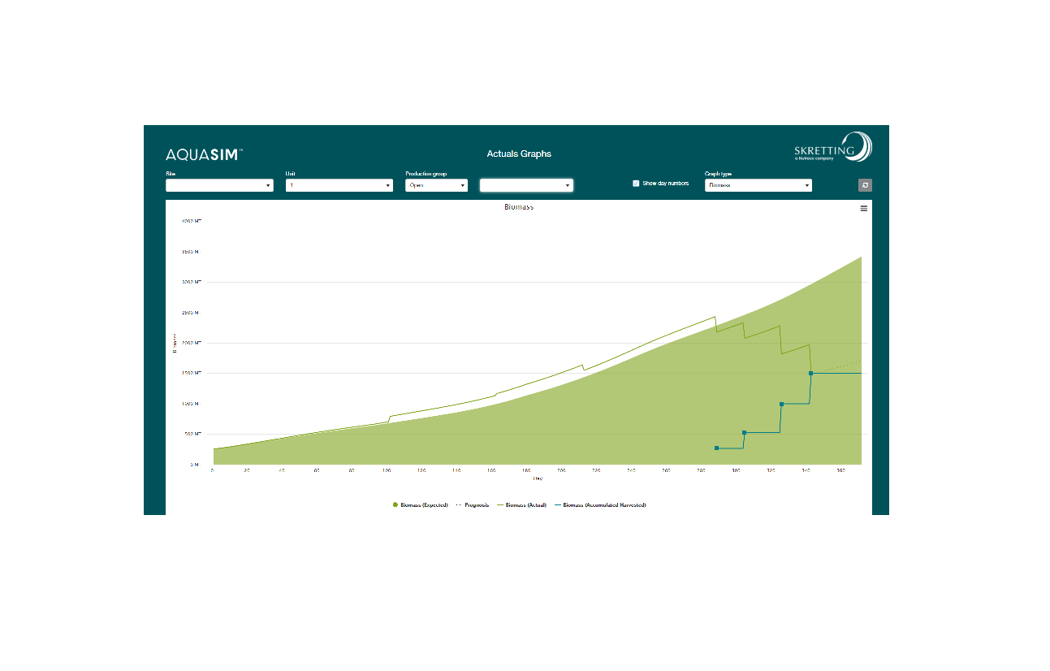
In biomass graph, biomass (expected) uses the weight and number in data from updated simulation, while biomass (actual) uses actual weight and number in when possible. Prognosis shows expected biomass growth based on last actual inputs, and biomass (accumulated harvested) shows the accumulated amount of harvested biomass.
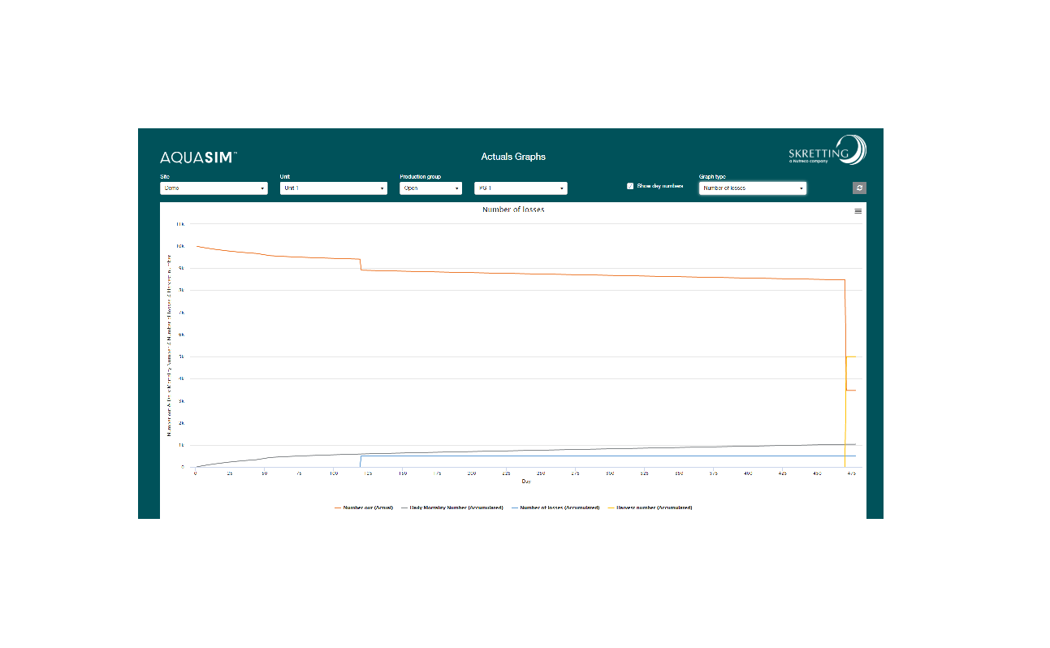
The number of losses graph shows the accumulated amount of losses together with actual number out, accumulated mortality number and accumulated harvest number.
'Actuals' module is useful for registering actual production data and keeping overview of the whole production cycle.
'Simulation graphs' module offers the overview of the effects of simulation updates on the production group. They are based on the data generated from the settings in My Site as well as the updates in simulation.
'Simulation' module provides the possibility to explore what-if scenarios to see the effect of changes on different parameters as well as to improve forecast accuracy.