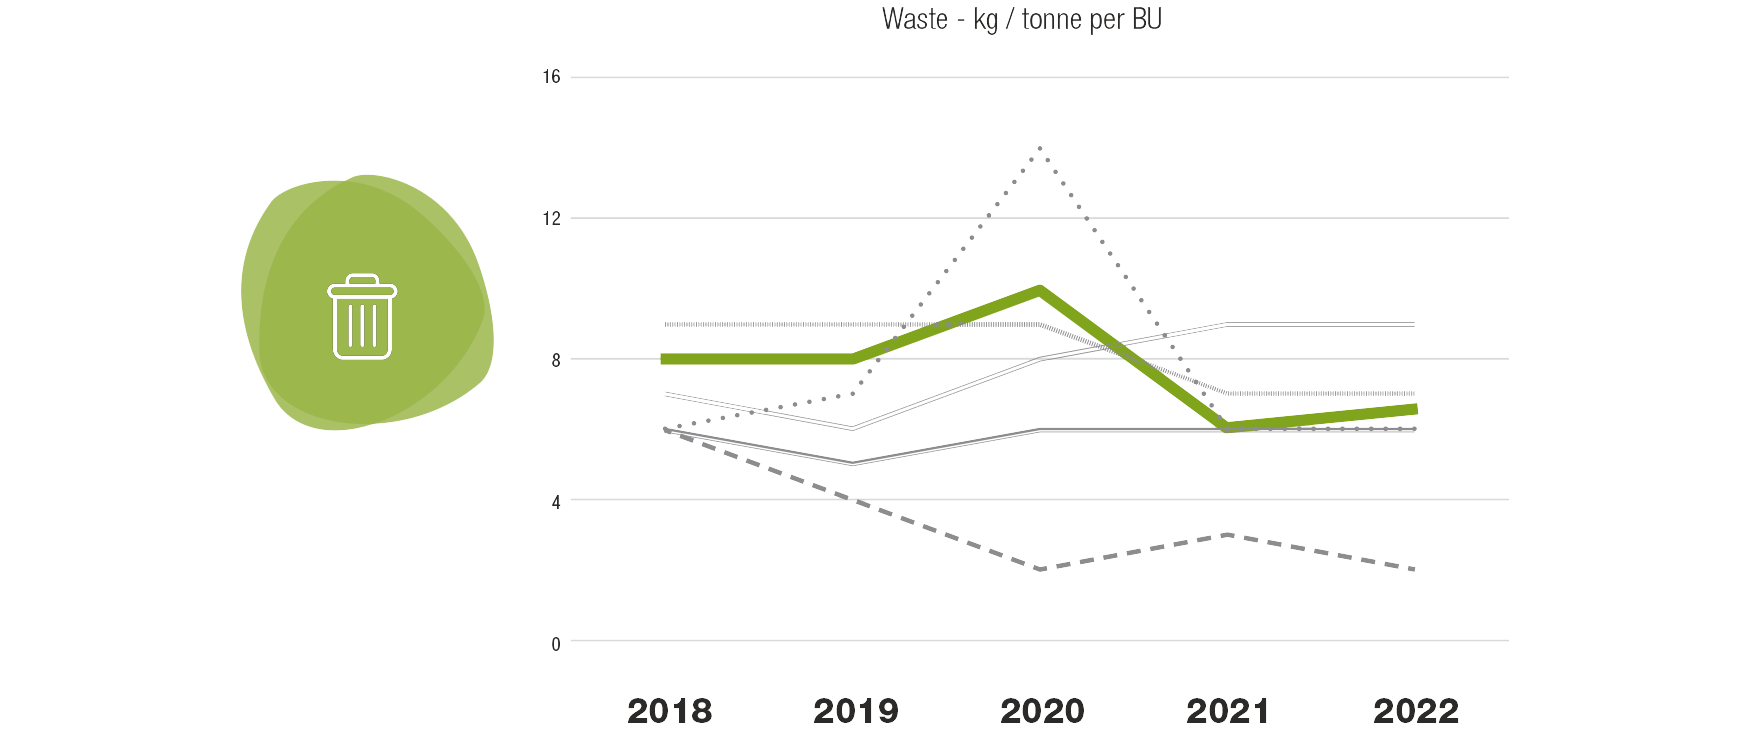


Scope 1 & 2 - Improving our own operations
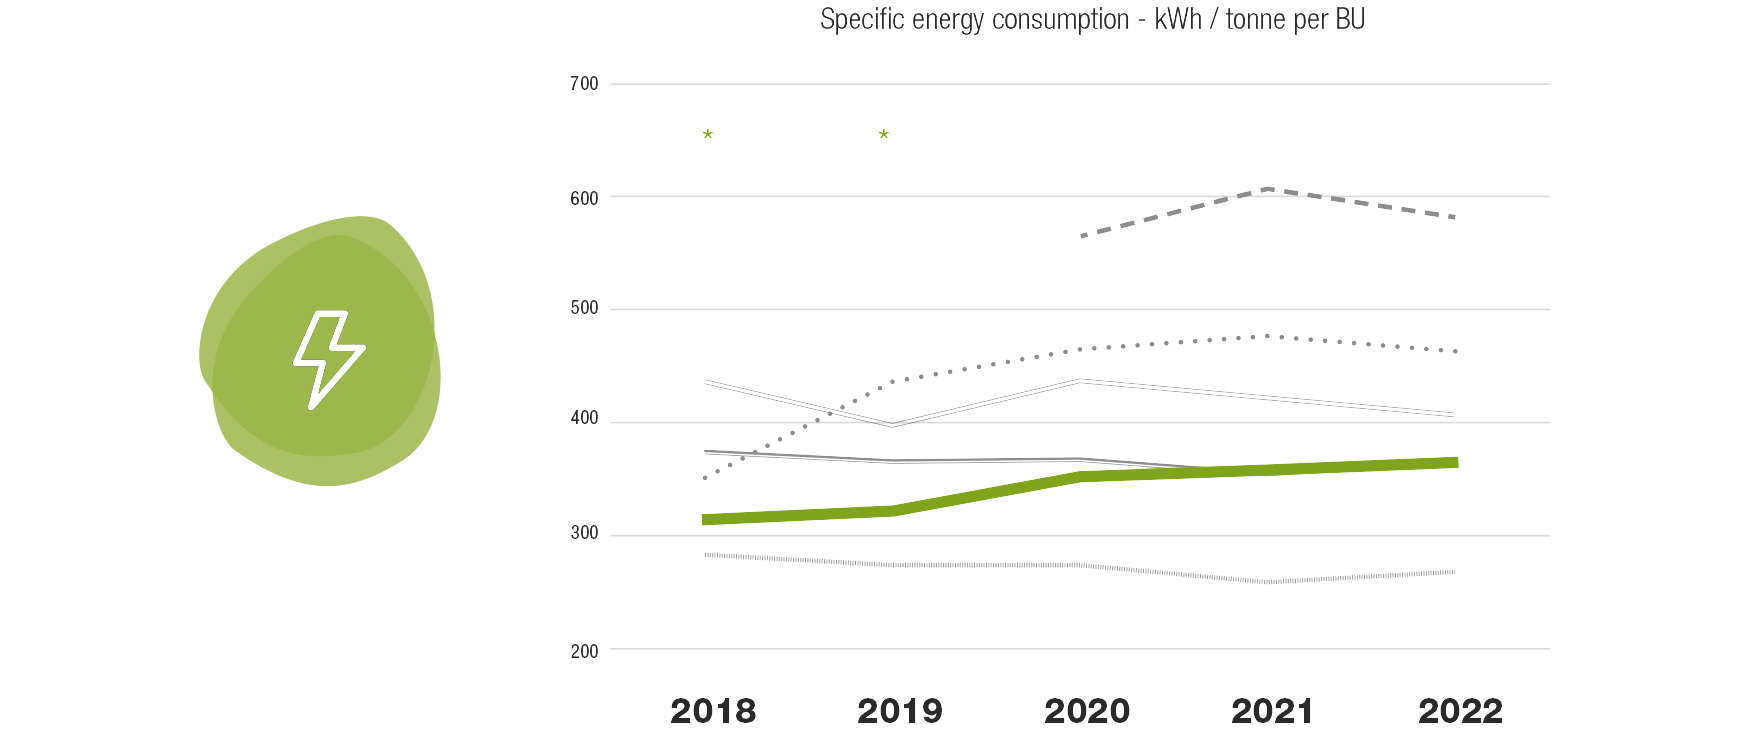
Despite numerous hurdles over the past year, Skretting managed to keep a focus on energy efficiency activities and CO2e reduction. Since 2018 our mature OpCos, like BU Salmon (Australia, Canada, Chile and Norway) and BU Southern Europe (France, Italy, Spain and Turkey), made significant reduction in CO2 emissions and energy (both specific and absolute terms). These OpCos are operating in consolidated markets and have a history of continuous improvement with a focus on efficiency. They are setting the path for our other OpCos to follow.
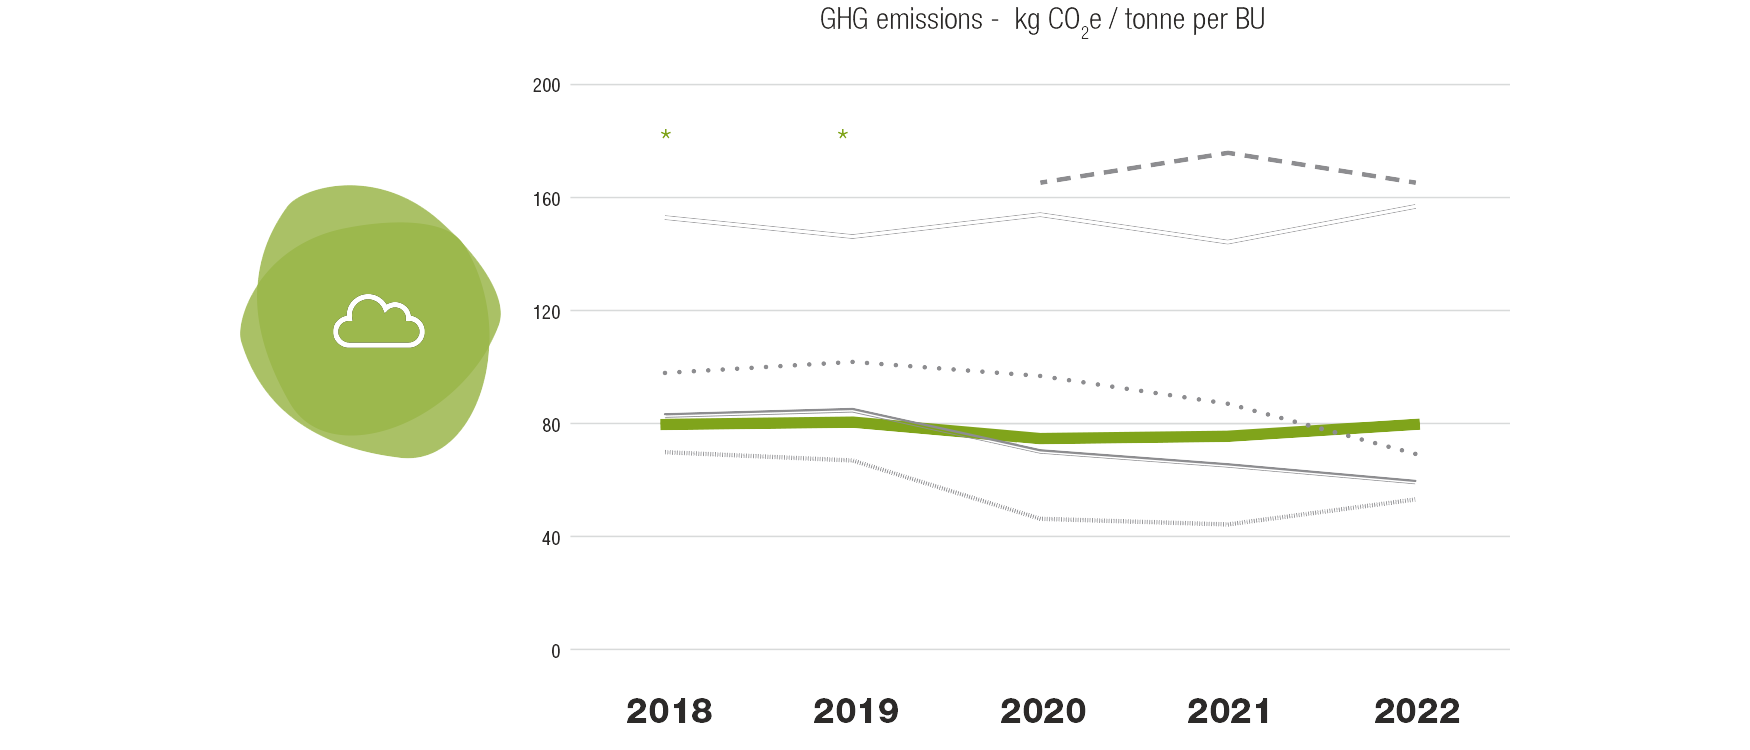
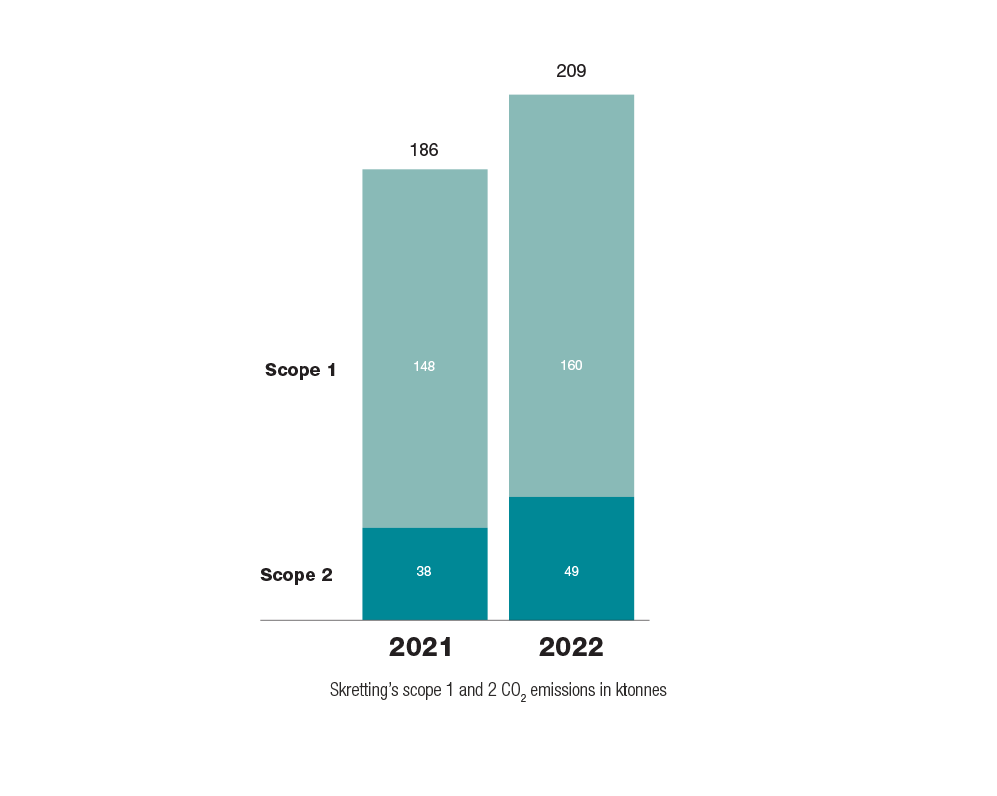
As shown below, scope 1 and 2 emissions increased in 2022 when compared to 2021. The scope 1 increase is directly correlated with the increase in shrimp feed volume. The specifics of shrimp feed production make it more energy demanding than the fish feed production process. On the other hand, Scope 2 footprint is not highly affected because we are using electricity from renewable sources in our factories in Ecuador.
Increase in scope 2 emissions is related to change in the electricity emission factor in Skretting Norway, from location based to market based (from 0.016 kg CO2e /kWh to 0.402 kg CO2e/kWh). Skretting Norway consumes 20% of the total electricity in Skretting. Therefore, the effect of the conversion factor change had a significant impact on the overall Skretting scope 2 result. Our Norwegian factories are the leaders of energy efficiency in Skretting. Our factory in Stokmarknes is the most energy efficient fish feed plant in Skretting. Read more in the Nutreco sustainability report.
Skretting will keep growing in the future. At the same time, we are committed to reducing our emissions in line with the Science Based Targets Initiative. We are aware that there is no simple and single solution for this problem, so we have started several initiatives across the company to tackle Scope 1 and 2 emissions.
Our approach for Scope 1 reduction includes upgrading our boilers to operate with the less polluting fuel sources, optimisation of dryers and reducing steam usage. For Scope 2 reduction we are developing a cost beneficial plan for de-carbonisation of electricity considering different alternatives like on-site power purchase agreements (PPAs), off-site PPAs and buying energy attribute certificates (EACs) where other alternatives are not feasible.
For us, the most important thing is that every factory has an energy target, measurement of energy consumption of the main users, to use data to better understand energy flows and make decisions about energy use. Previously we identified gaps in energy monitoring systems in some of our factories. 2022 was a year of closing these gaps. We improved energy monitoring and increased energy reporting frequency of all factories. Improvements in energy management systems and good data quality are foundation for any future progress in energy efficiency.
 * BU Africa missing due to reporting errors
Scope 3 emissions on a global and regional level
In 2022, our scope 3 carbon footprint was approximately 4,801 ktonnes of CO2e. This is approximately 1.3 times the greenhouse gas emissions of a city like Amsterdam.
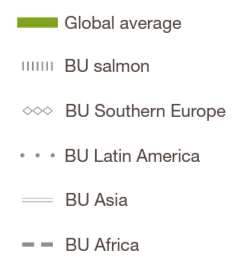
Looking at the scope 3 split by region and business unit, we see that the highest contributors to our scope 3 are our salmon business (approximately 44%) and our business in Latin America (approximately 35%). This correlates with the volumes of feed produced in these regions and business lines, but is also influenced by different diets and ingredient sourcing.
Compared to our baseline in 2018, our scope 3 footprint increased by approximately 16%. This is due to our strong growth in Latin America, which counteracts the reduction success achieved for example in BU Salmon, where scope 3 emissions were reduced by approximately 9% within the same time period.
This is a dilemma that we are facing today as business growth almost always increases the scope 3 carbon footprint, so that reduction efforts need to be even stronger in order to achieve any reduction success at the company level in absolute terms.
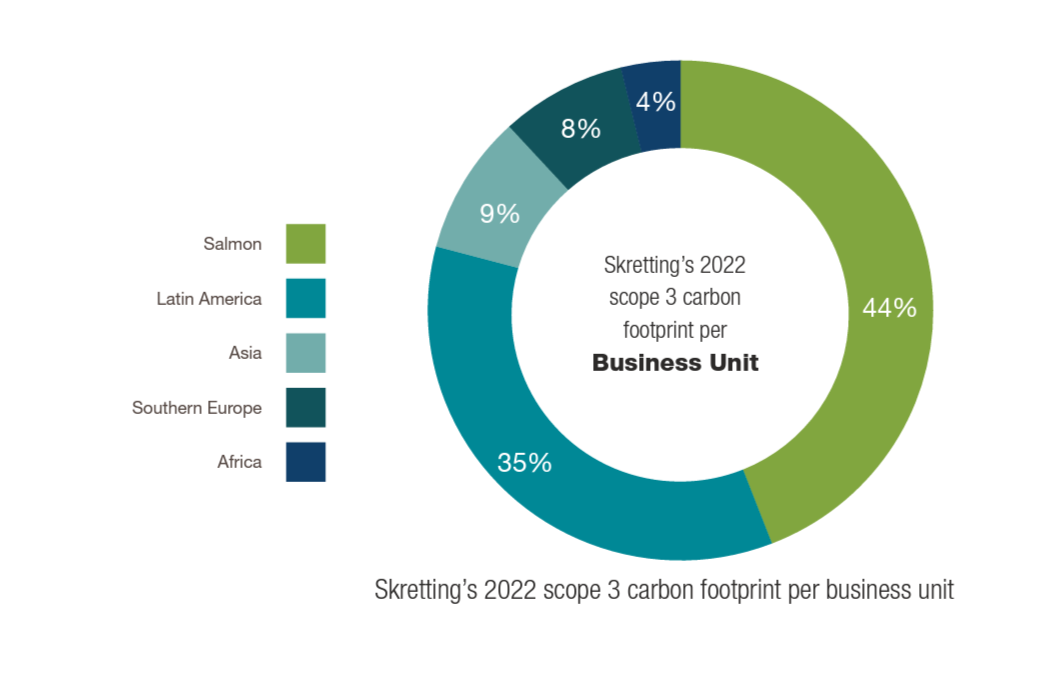
Looking at our scope 3 footprint from an ingredient perspective, we see that most of it (approximately three quarters) is linked to vegetable ingredients.
This is mainly due to land management practices for growing the crops on the fields but also due to land use change that happened up to 20 years ago.
Nevertheless, other factors play a role too, for example energy use for processing the crops into feed ingredients (for example soybeans into soybean meal and oil). Ingredients are unique, and depending on which raw material we are looking at, the carbon footprint drivers behind can be quite different.
Land animal proteins (such as animal meal) and marine ingredients (such as fish meal or fish oil) each contribute approximately 9% to our scope 3 footprint. Microingredients play only a minor role, mainly due to low volumes used in feed.
When we dive deeper into our ingredient footprint, we see that soy-based ingredients make the highest footprint share, followed by rapeseed oil and wheat-based ingredients. The top 10 ingredients comprise almost two thirds of Skretting’s scope 3 footprint. This is where we will focus in order to make progress in our scope 3 reduction.
Focusing our efforts on our supply chain
In 2021, Nutreco defined its internal footprint database, which maps all our purchased ingredients with quality assured LCA metrics, aligned with leading LCA standards. The database covers seven different environmental impact categories that are the most relevant for feed products, including the carbon footprint, but also other metrics like water footprint or land use indicators.
In 2022 the focus was on connecting this database to different internal data systems. This is important, because integrations enable us to automate calculations and report the footprint of our products and company. In addition, we can then share this information between business functions and OpCos where the reduction efforts ultimately need to take place.
A significant milestone reached in 2022 was the finalisation of our scope 3 carbon footprint dashboard. This enables us to calculate and track our footprint, while also providing valuable insights into the regions in which we are operating, and which of our local operations, ingredients, and suppliers contribute the most to our corporate carbon footprint.
A second milestone was to better integrate these footprint metrics into our feed formulation software. We completed this in 2022, which gives us a powerful tool to ecodesign our products in future by considering footprint metrics next to price and nutritional quality in product formulation.
This integrated solution also helps us to calculate product footprints in a more automated way, and to understand how different formulation choices will impact our footprint on product level. The integration is now available for all our OpCos and already actively used in our key markets in Europe, North and South America and Australia.
We have also developed an internal tool with which we can calculate the full cradle-to-gate footprints of our products by simply selecting the product packaging, location of the plant and outbound transport information, and add it to the raw material footprint for a specific formulation.
In 2022, we requested LCA data from 32 global suppliers via a dedicated LCA data collection and quality assessment template.
In addition, we have put further focus on gathering supplier LCA data and streamlined this data collection approach based on our scope 3 dashboard insights. In 2022, we requested LCA data from 32 global suppliers via a dedicated LCA data collection and quality assessment template.
When it comes to carbon footprint reporting, in 2022 we have further improved our reporting templates. These are actively used to report carbon footprint values of our products, both on demand and on a regular basis. The reporting templates have been well received by our customers as they give transparent insights into the main drivers behind the footprint, not only per product, but also per life cycle stage or raw material contributions. In addition, the calculation methodology and used data sources are documented.
Next: The carbon footprint of our products
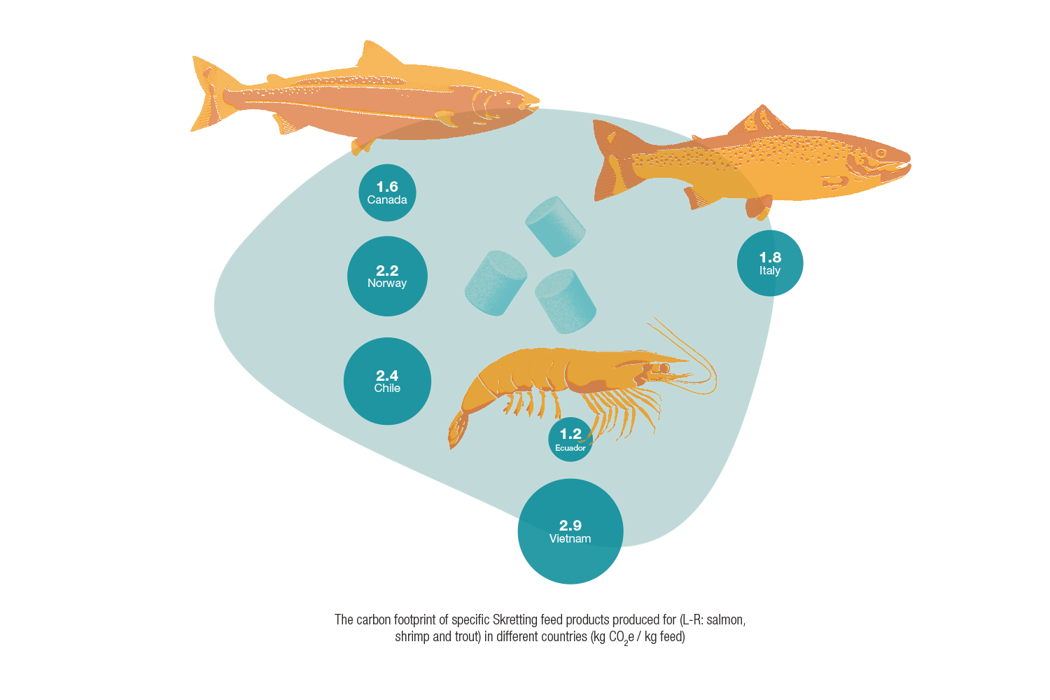
The carbon footprint of our feed can differ significantly depending on the species, but also on the regions and markets where feed is produced and sold.