Skretting Sustainability Report 2022

read the report (PDF)

The carbon footprint of our products

The carbon footprint of our feed can differ significantly depending on the species, but also on the regions and markets where feed is produced and sold.

The difference based on species can be due to different nutritional requirements of the species within their specific environments, which has a subsequent influence on the type of ingredients that are required. In addition to nutrition, we have to consider the biophysical characteristics of the feed itself, in order to reduce feed loss and optimise feed uptake, for example.

Moreover, purchasing and regulatory conditions can be quite different in the different regions and countries of the world, which impacts the feed composition, raw material availability and origins, and subsequently the feed footprint.

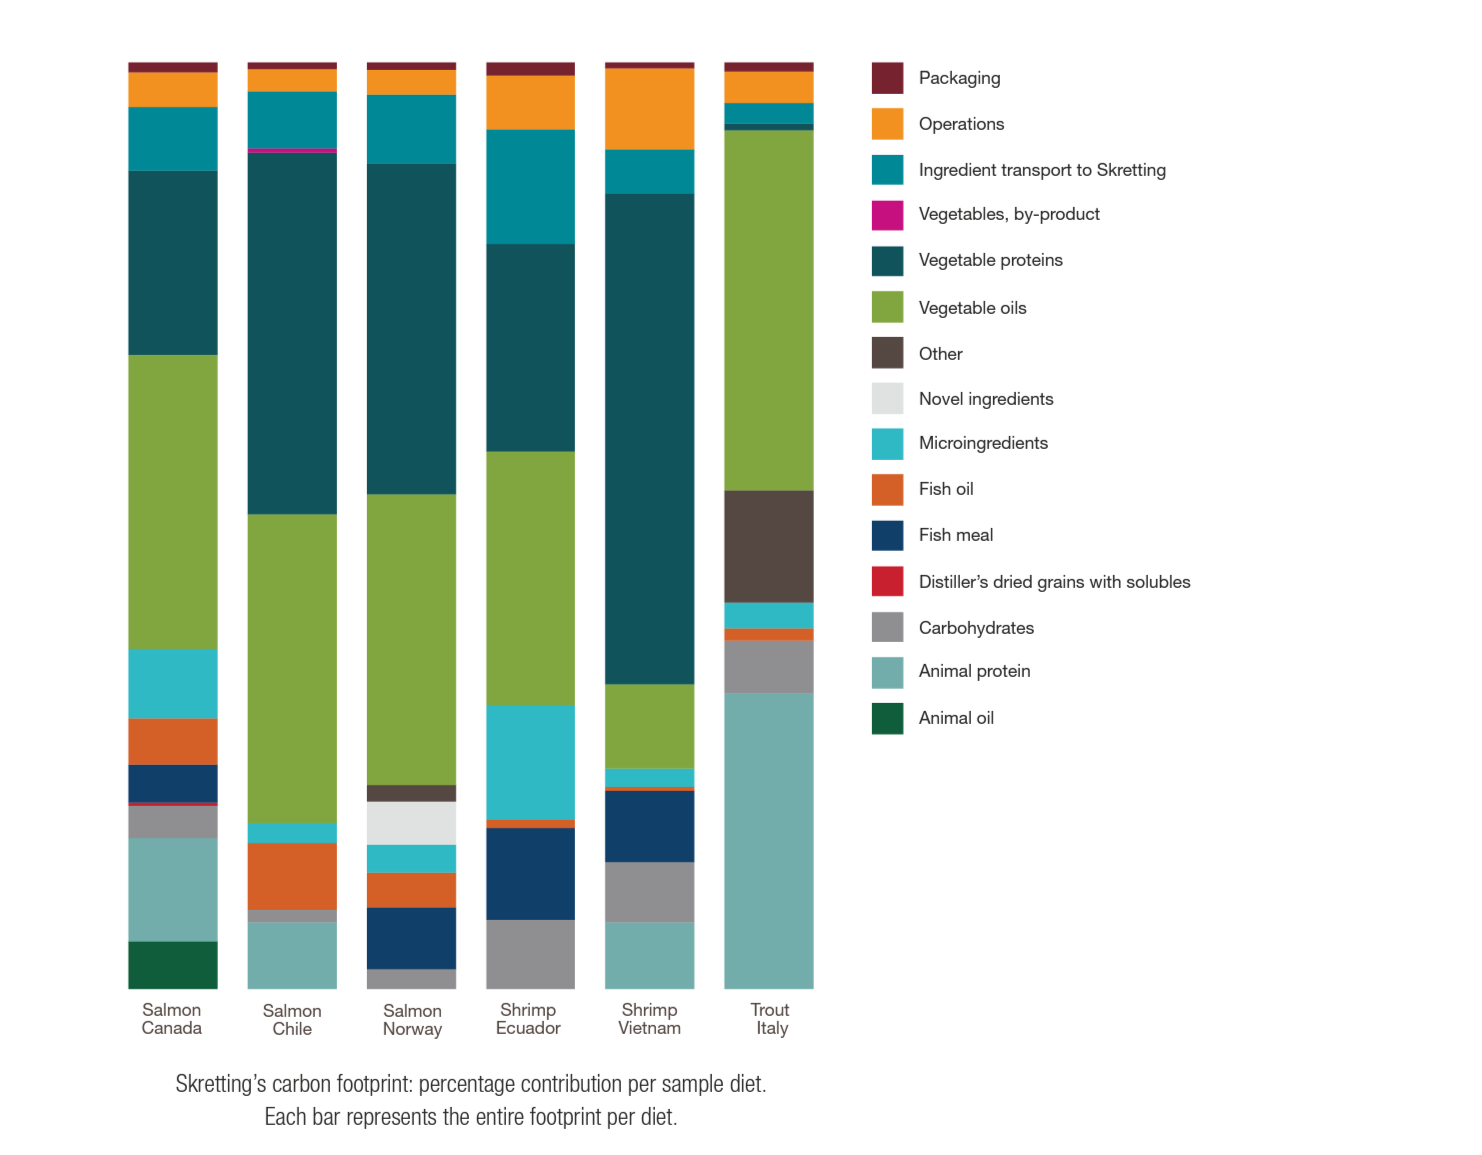
To provide further insights into these differences and the main causes, the carbon footprint for a range of Skretting feeds is shown on this page. Further on, we take a closer look at the drivers of the differences in carbon footprint per region (for example a salmon feed produced in Canada, Chile and Norway) and also a comparison between species (salmon feed, shrimp feed, trout feed).
The impact of location on the carbon footprint

Salmon diets

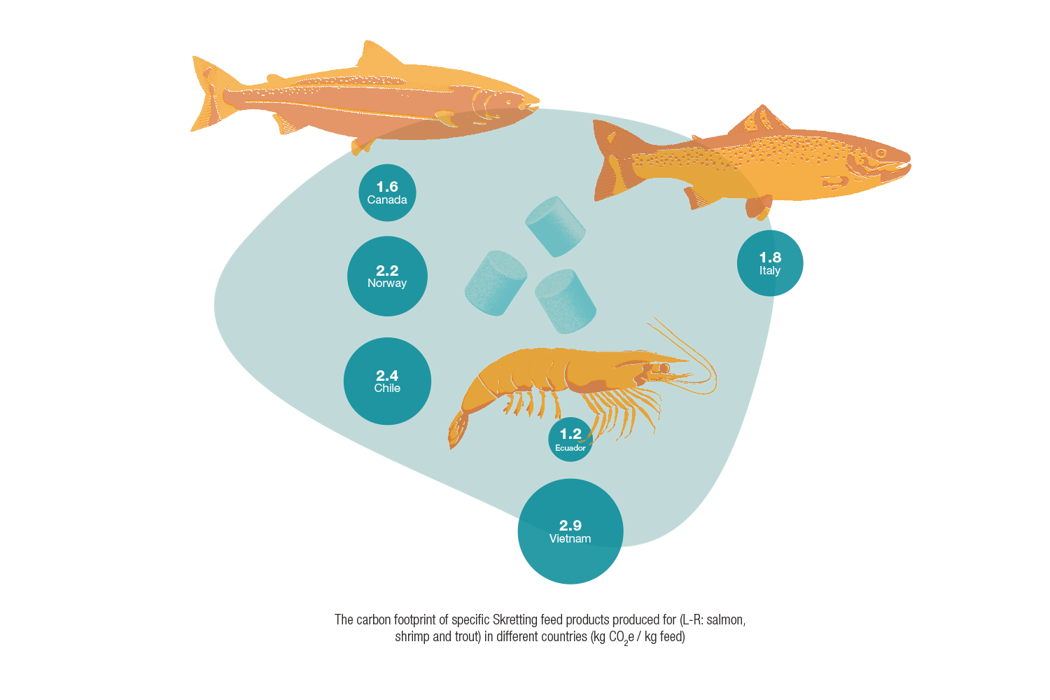
When we examine one specific global salmon diet produced in different countries (Canada, Chile, Norway) as a reference, the carbon footprint from cradle-to-gate [including ingredient production (including land use change), transportation to feed facility, feed manufacturing, packaging and packaging end-oflife] fluctuates between approximately 1.6 kg CO2e/ kg feed (Canada) and approximately 2.4 kg CO2e/ kg feed (Chile). This is mainly due to different raw material sourcing, but also because of different ingredients used in the diets.

In Canada, the protein source is to a significant extent derived from animal by-products, that come with a comparatively low specific raw material footprint. Further, the vegetablebased proteins and the oil-based ingredients are predominantly locally sourced. This also results in the fact that the land use change share in the Canadian diet is lowest (approximately 16% of the overall footprint) compared to the other two salmon diets.

In Chile, significant amounts of animal by-products are used in the salmon diet. However, largely due to vegetable oil and vegetable protein sourced from South America, with a potential high land use change footprint linked to them, the overall feed footprint is higher than the Canadian or Norwegian value. The land use change share contributes to almost half of the overall diet’s carbon footprint in this case.

In Norway, no animal by-products are used in the diet, primarily due to market acceptance, which results in a generally higher footprint compared to the Canadian diet. Some of the vegetable ingredients that are used instead are also carrying some land use change share that contributes to the overall carbon footprint. However, despite using more vegetable ingredients, due to sourcing them from specific suppliers with a lower land use change footprint linked to their products, or from Europe, the land use change footprint is lower than, for example, in the Chilean diet, and this results in a lower overall carbon footprint.

Looking at the footprint related to inbound logistics, despite the difference not being so large, we can identify a lower footprint for the Canadian diet. This is due to that in Canada, ingredients with highest inclusion are sourced locally.

Shrimp diets

Looking at the examples for shrimp diets, the differences in the carbon footprint between the grower diet produced in Ecuador and the diet produced in Vietnam are larger than the ones between the salmon diets. The vegetable protein component and the manufacturing is significantly higher for the diet produced in Vietnam. The key influencing parameter in this case is a high inclusion of soy-based ingredients from South America, which comes with a high land use change related carbon footprint that contributes a significant component of the footprint.

Vegetable-based ingredients also contribute the biggest share in the carbon footprint of the Ecuadorian diet, but due to sourcing from other regions, the land use change share is much lower which results in a much lower carbon footprint of the overall diet. The differences in the footprint related to feed manufacturing are largely due to more energy efficient processes in the Ecuadorian facilities, resulting in a lower specific energy consumption (lower kWh/tonne feed produced) but also due to differences in the energy sources, as the share of renewable energy sources in Ecuador is significantly higher than in Vietnam.

Footprint drivers between different species

Footprint drivers between the species are primarily due to different feed compositions and the origin of ingredients.

For example, there is a relatively high inclusion of animal by-products in the trout diet that contribute to the carbon footprint. In addition, more poultry-derived animal protein is used, which comes with a higher specific carbon footprint compared to other animal by-products. In addition, minimal vegetable protein ingredients are used in the trout diet and thus this ingredient group contributes the least to the carbon footprint compared to the salmon or shrimp diets.

The shrimp and trout diets also contain more carbohydrates, which explains a slightly higher carbon footprint due to this type of ingredients, despite carbohydrates generally contributing a lower specific footprint compared to for example most vegetable proteins or oils.

Vegetable oils play a similar significant role in salmon diets as in the trout diet, both in terms of volume but also carbon footprint. Despite similar inclusion of vegetable oil used for example in the Canadian salmon diet and in the Italian trout diet, the oil in Italy is sourced from the European market while in Canada most is sourced locally and linked to a lower carbon footprint (in total, but also land use change related). For the Italian diet, the carbon footprint linked to ingredient transport to the plant is lowest across all diets presented, as most ingredients are sourced within Europe.

The LCA learning curve

Incorporating the LCA methodology into our business is a long-term process rather than a one-time task that we can simply tick off. For long term success, integrating a new mindset around life cycle thinking and management demands a stepwise approach and needs to involve almost all functions of the business. Data improvements over time will help to make calculations and decisions more robust and meaningful.

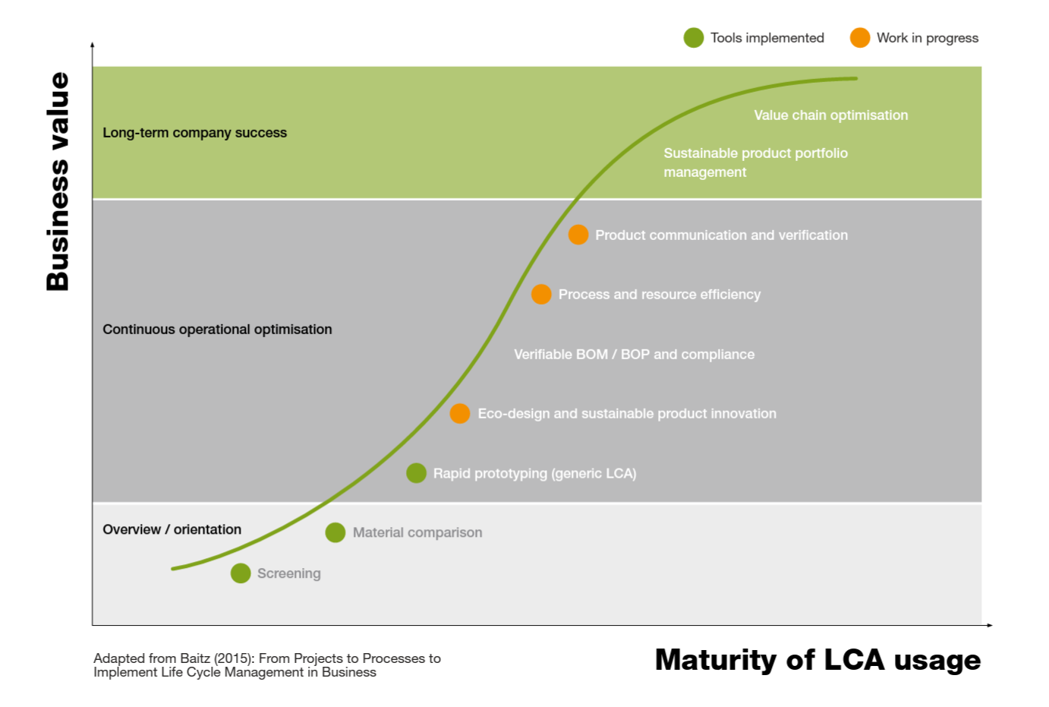
Looking at the LCA maturity curve, we have left the orientation phase. With the tools in place, we know about the general footprint drivers of Skretting, our main products and feed ingredients. Furthermore, by connecting LCA data to internal data systems, we are already able to increase the automation in calculating carbon footprint data for different products.

Despite this progress, we are still far from being at the top of the curve. The current focus lies on further optimisation/ automation and certification of processes to more efficiently calculate the footprint of our products in order to meet the increasing customer/stakeholder requests. At the same time, the collection of primary data has begun with a structured approach to reduce data uncertainties and to make better sourcing decisions. The external verification of our calculation setup has also been initiated, and we plan to get this process finished in 2023.

We are facing five core challenges when it comes to LCA:

1. Comparing apples to apples

LCA is still relatively new in the broad business environment, and standardisation is an ongoing process.

Robust and comparable data is urgently needed in order to make reliable decisions. This is true for all stakeholders of the value chain.

To deliver reliable numbers to our customers we are following the leading LCA standards, in particular the Product Environmental Footprint standard (PEF), specifically the PEF Category Rules for Feed (PEFCR Feed), based on ISO 14040/44 standards.

We plan to get our LCA approach third party verified in 2023.

2. Knowing ingredient origins

LCA is a data-intensive process, and the results can only be as good as the quality of data that is going into it.

Having good supply chain transparency is key to reduce the uncertainty behind LCA results. For vegetable ingredients in particular, it is not enough to know where our tier 1 suppliers are sitting. We need to trace back to the places of crop production, where a big share of the footprint is created.

We have this information available for the majority of our soy and palm oil ingredients, and want to extend this to other vegetable ingredients (for example wheat, rapeseed, barley) in 2023. At the same time we are planning to integrate this information into our central data systems in order to use it for more automated and accurate footprint calculations.

3. Obtaining more primary data

An important aspect that is often not well addressed when footprint metrics are calculated and communicated, is data quality. Our current scope 3 baseline and the ingredient-related footprint of our products, is mainly based on averages or secondary data. While this is aligned with LCA standards and we take out information only from quality assured LCA databases, averaged data comes with uncertainties.

To generate more accurate calculations and to differentiate better performing suppliers, we need more primary data. We have already begun to request primary data from key suppliers in 2022 but will increase this collection effort significantly in 2023. To create a level playing field and collect data that is comparable, we have developed a specific data collection template including a data quality questionnaire. We also have an internal data quality check procedure to guarantee alignment of supplier LCA data with the leading LCA standards before we take any primary data into our footprint database. We also want to introduce a data quality KPI into our systems that shall allow us to track, validate and consistently reduce data uncertainty.

4. Considering all impacts and the full life cycle

Following the life cycle mindset, knowing the footprint of our products is great, but not enough. There is a risk of shifting environmental burdens downstream, for example if we optimise the footprint of our feed it may become less digestible. In some cases, increasing the footprint of feed might be even beneficial when this leads to a footprint reduction downstream.

To quantify and capture this, we need to set up models that enable us to calculate the environmental impacts from feed digestion and end-of-life on-farm. In 2023 we are planning to build such a model and connect it to our feed footprint calculation system.

5. Dealing with highly volatile raw material prices

The current market is challenging as prices of raw materials are fluctuating. This not only has direct influence on purchasing but also on the sustainability choices, and ultimately on the cost of the feed.

Sustainable procurement often needs longer term commitments which can be challenging in such a volatile market. We believe that incorporating external costs by environmental damage can be a lever and provide a fairer level playing field between low footprint ingredients compared to some high footprint (but low cost) conventional alternatives.

In 2023, we are looking into introducing a carbon price for raising this awareness and also consider it in business cases together with customers and suppliers.

Next: Initiatives from our Operating Companies

Learn more about some of our sustainability initiatives around the world.

read next

In this section

Scope 1, 2 and 3 emissions
The carbon footprint of our products
Initiatives from our Operating Companies