Digital solutions to enable precision farming

Shrimp economics

This module provides the insight on the possibility of the economical results and helps users to make best harvest decision based on the prediction of profitability. There are 6 tabs: production group, feed prices, market prices, shape distributions, economical result, and harvest prediction.

Cost

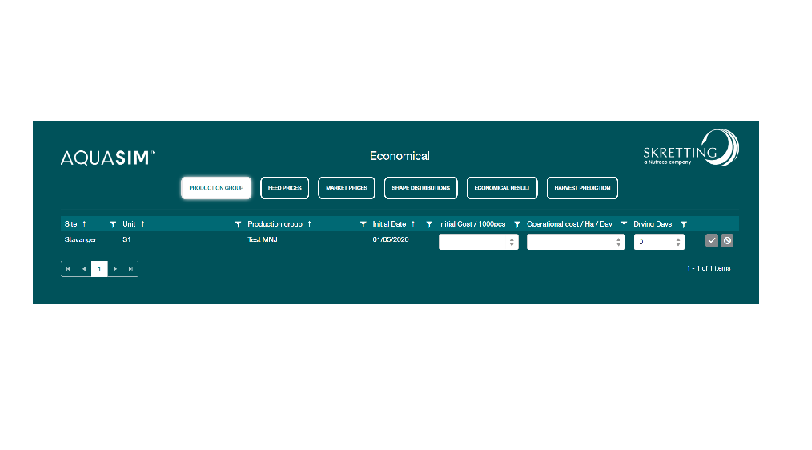
In Production group tab, first find the production group in the list, and then click on the pencil to edit. In the edit mode, provide the information about initial cost and operational cost for the production group, and save the input.
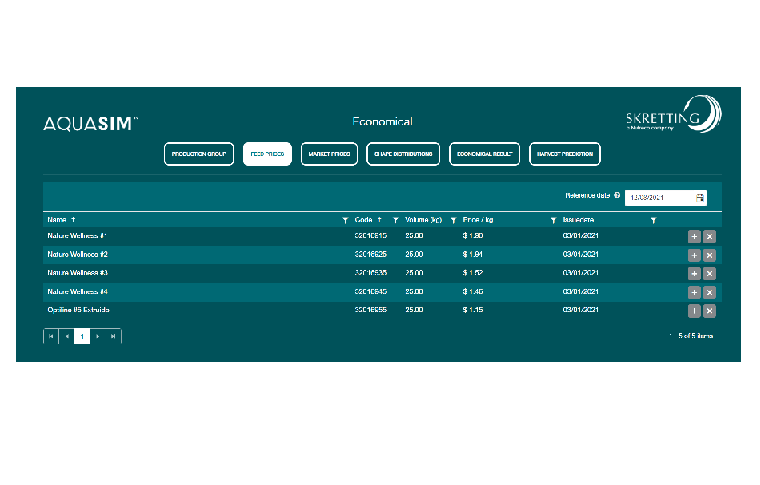
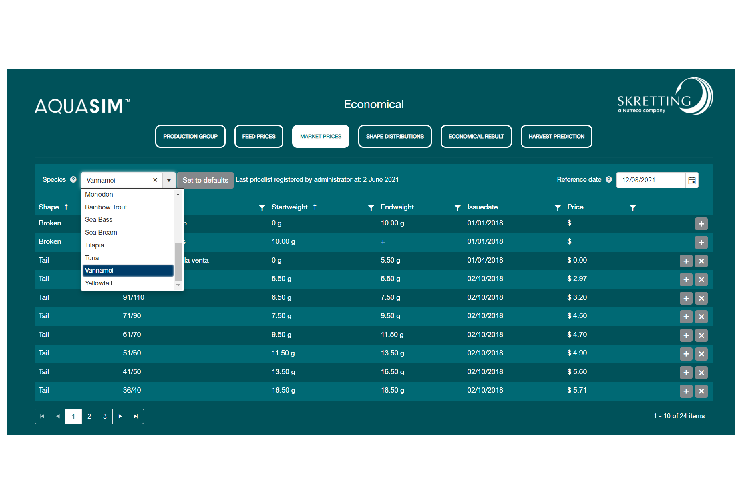
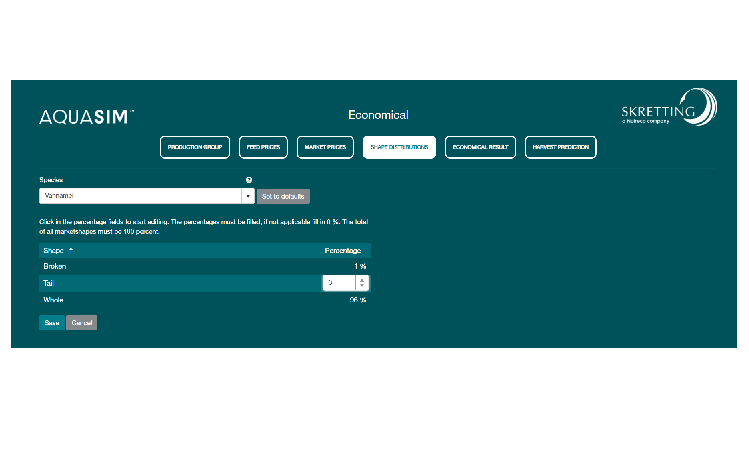
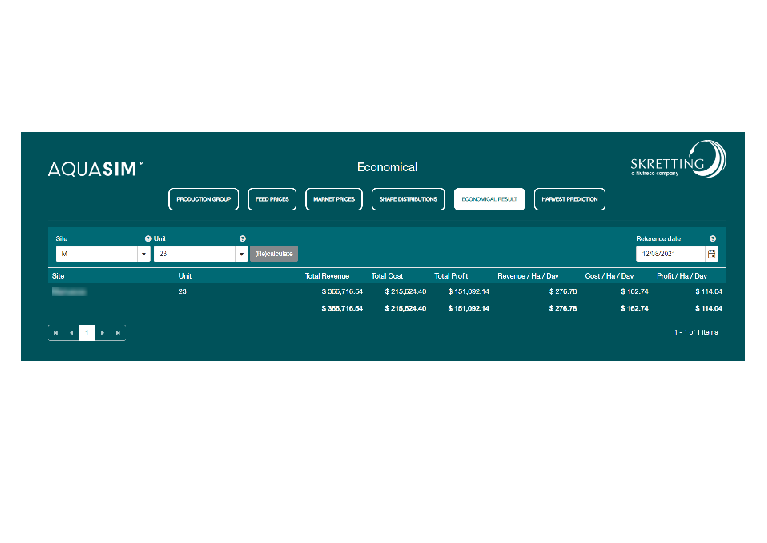
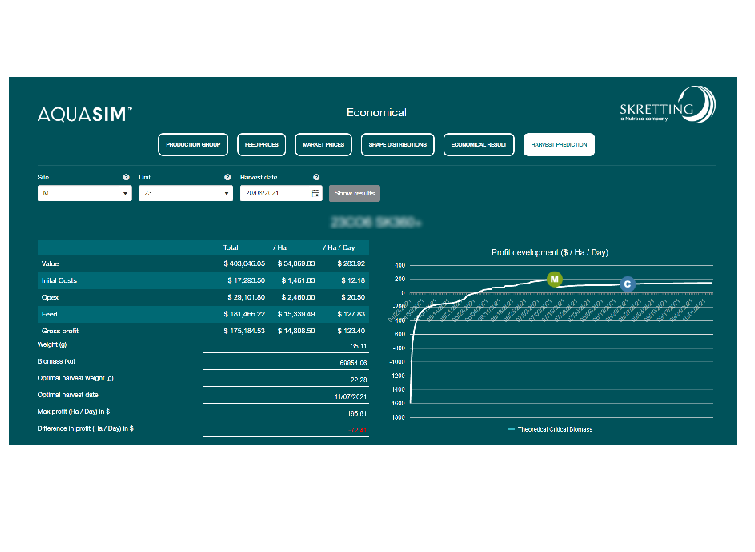
In Feed prices tab, first select the reference date for the feed price. The default date is today, but you could select other dates as reference date. Then update the feed price for the reference date. Be aware that all feed displayed needs to have at least an issue date before the start of the production group for the calculation to be able to succeed.

Income

In Market prices tab, first select species and reference date, then all shapes and size classes for the species are displayed and the price applicable are shown. With these two button image0e5ni.png, you can add and delete the market prices for the reference date. 'Set to defaults' will retrieve the base prices from Masterdata module, but if you have provided market price on more recent date in this module, the newer market price will be shown.

In Shape distributions tab, first select the species. The default market shape percentage are automatically loaded, and you could click on the numbers to edit the percentage. It's possible to fill in 0 %, but the total must be 100 %. 'Set to default' will use the default settings from Masterdata module.

Result

In Economical result tab, first select the reference date. Then select site and unit or leave the unit field blank to show the result of the whold site. Click 'show' button to see the (cached) result. If you have just updated prices, click 'recalculate' to see the updated result.

In Harvest prediction tab, select the site, unit and the date for harvest and click 'show results' button. The table to the left shows the value, cost and profit if the production group are harvested on that day, as well as the suggestion for the optimal harvest date. In the graph to the right shows the profit development of the whole production cycle, so users could make better harvest decision.