Digital solutions to enable precision farming

Simulation

This module can be used to update simulation, improve forecast accuracy and compare feed efficiency. It provides the possibility to explore what-if scenarios to see the effect of changes on different parameters as well as to optimise forecast due to different planned farming operations. The updates in the 'Simulation' module will be used by AquaSim in the other module such as 'Actuals', 'Daily feeding' and 'Feed prognosis', and thus provide better forecast based on the updates in this module. There are different types of simulation, including RGI, FCI, feed type, mortality, temperature, harvest, ration and other environmental parameters for some species.

Select production group and simulation

First, choose site, unit, production group and simulation type from drop down menu. If you want to see a specific time range, fill in date or day for the simulation period. Otherwise, leave these fields blank to see simulation for the whole production cycle.

Editing and saving simulation data

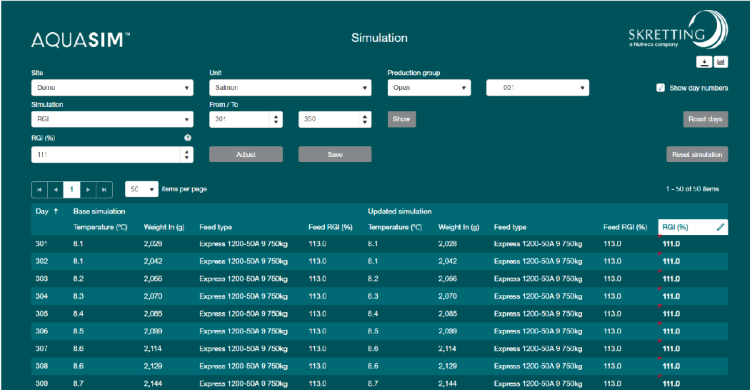
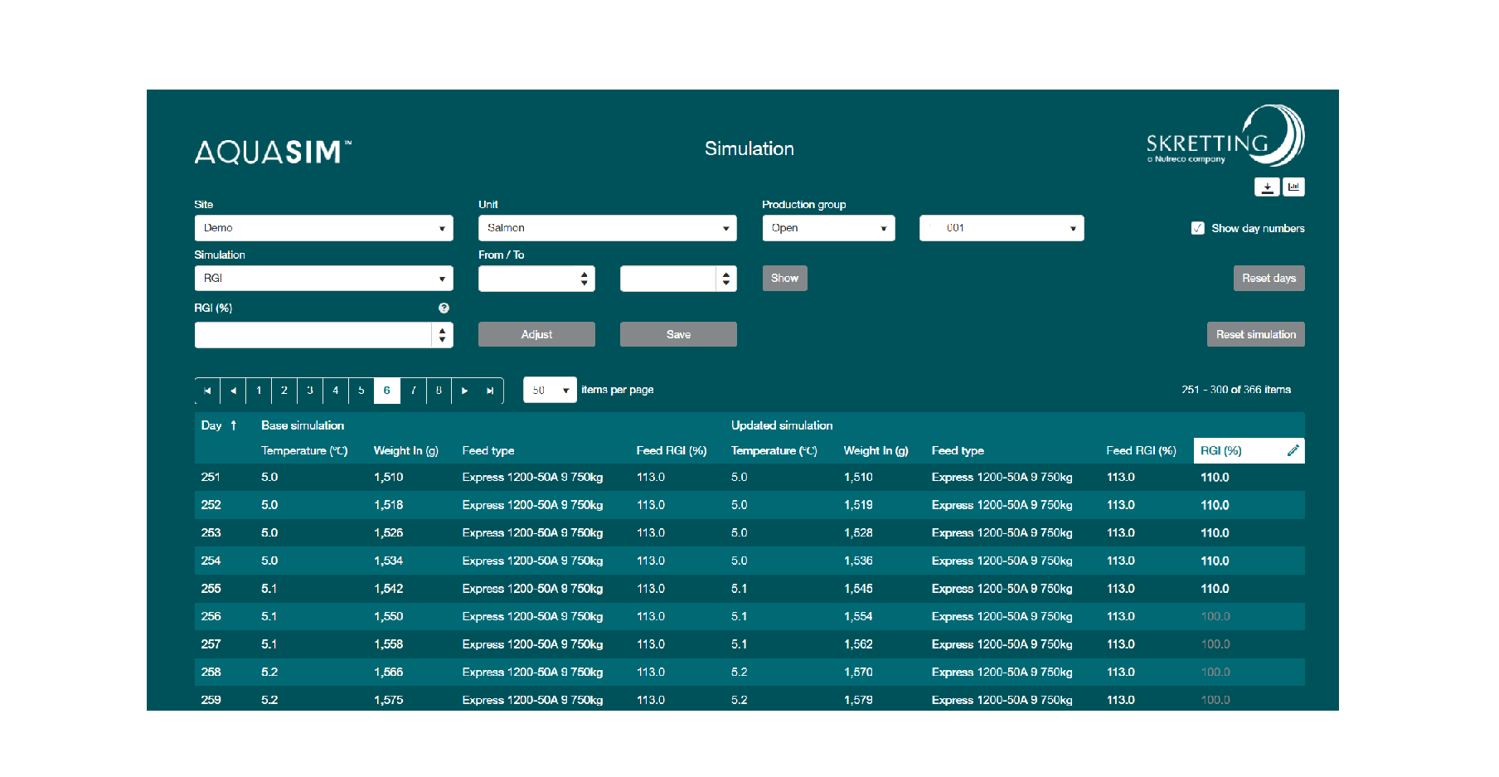
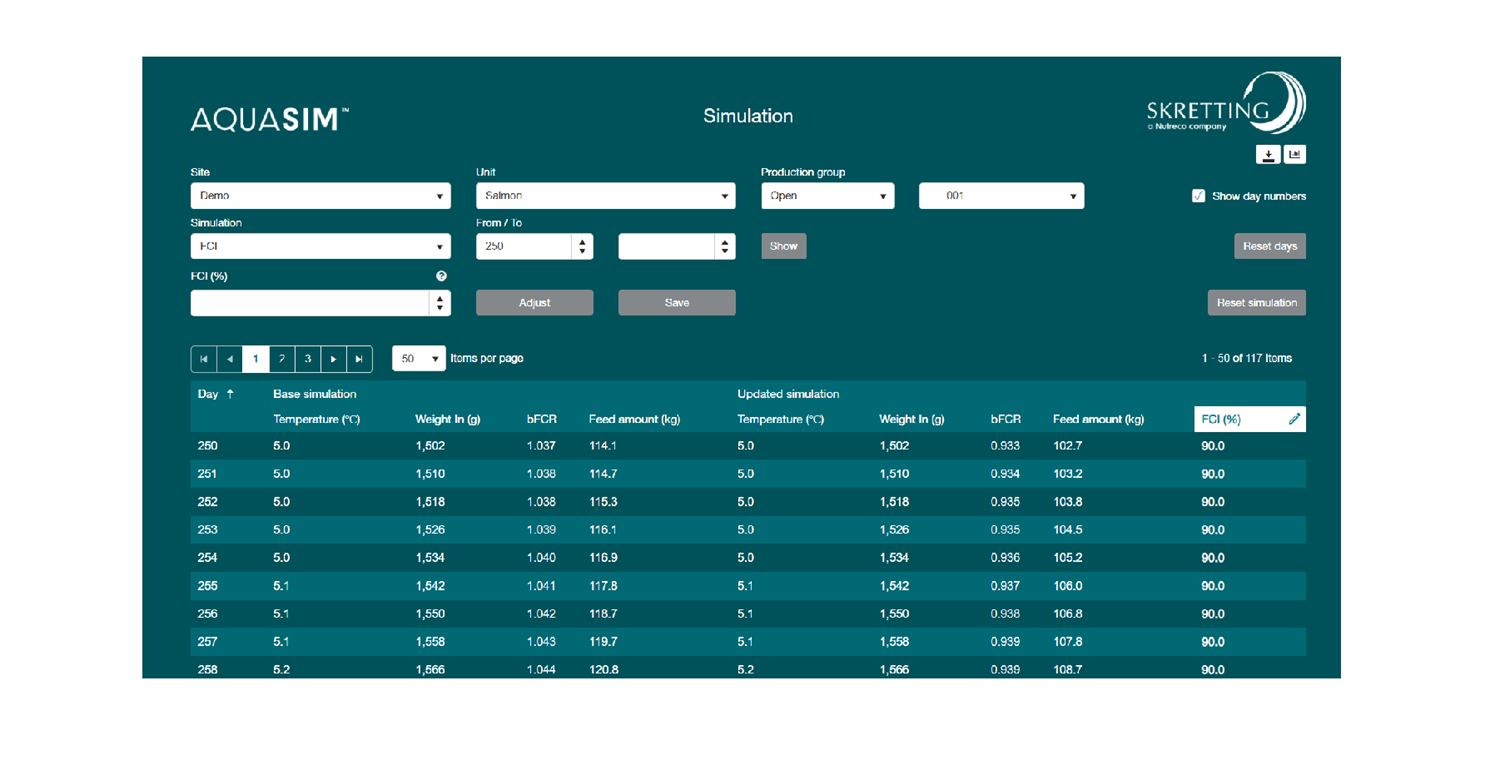
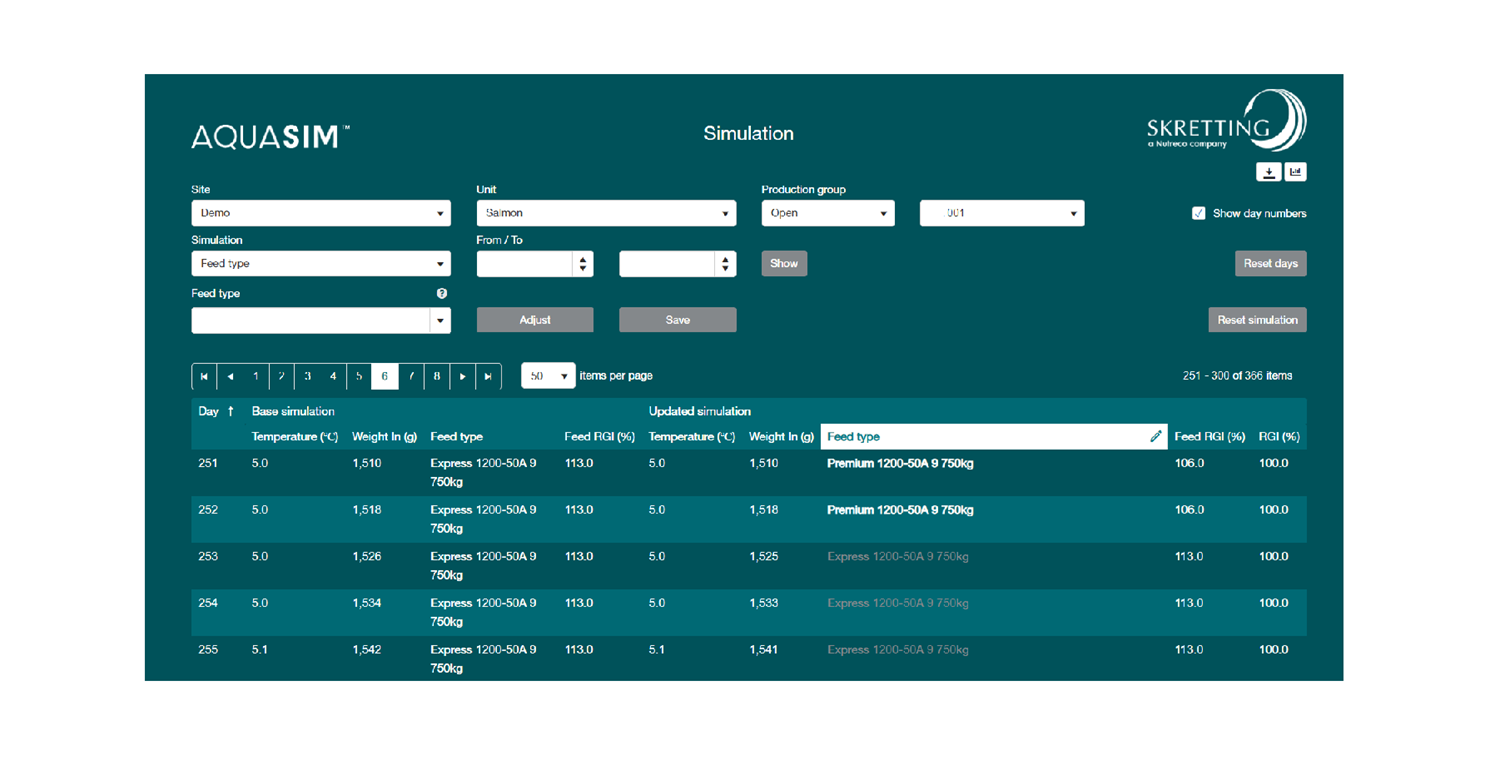
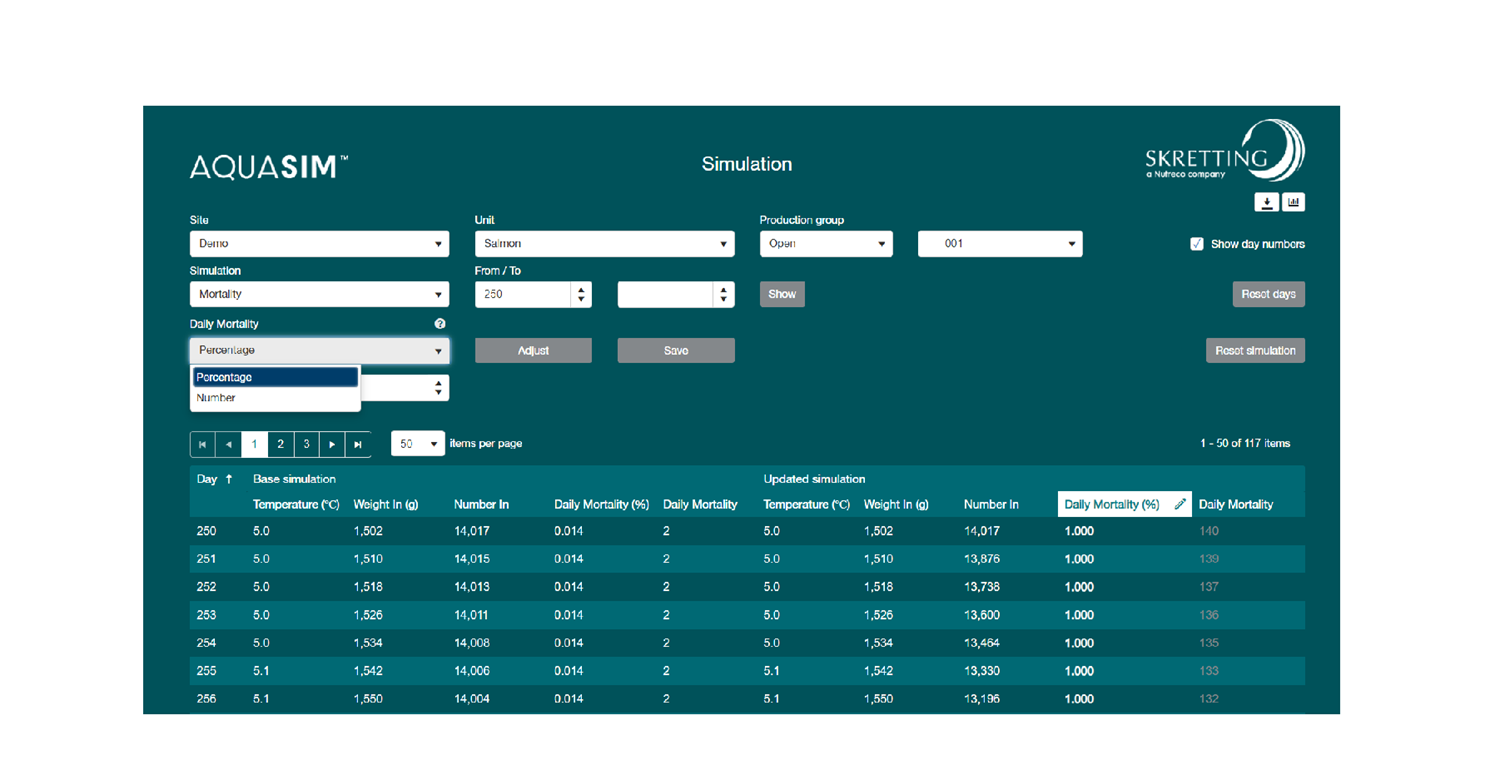
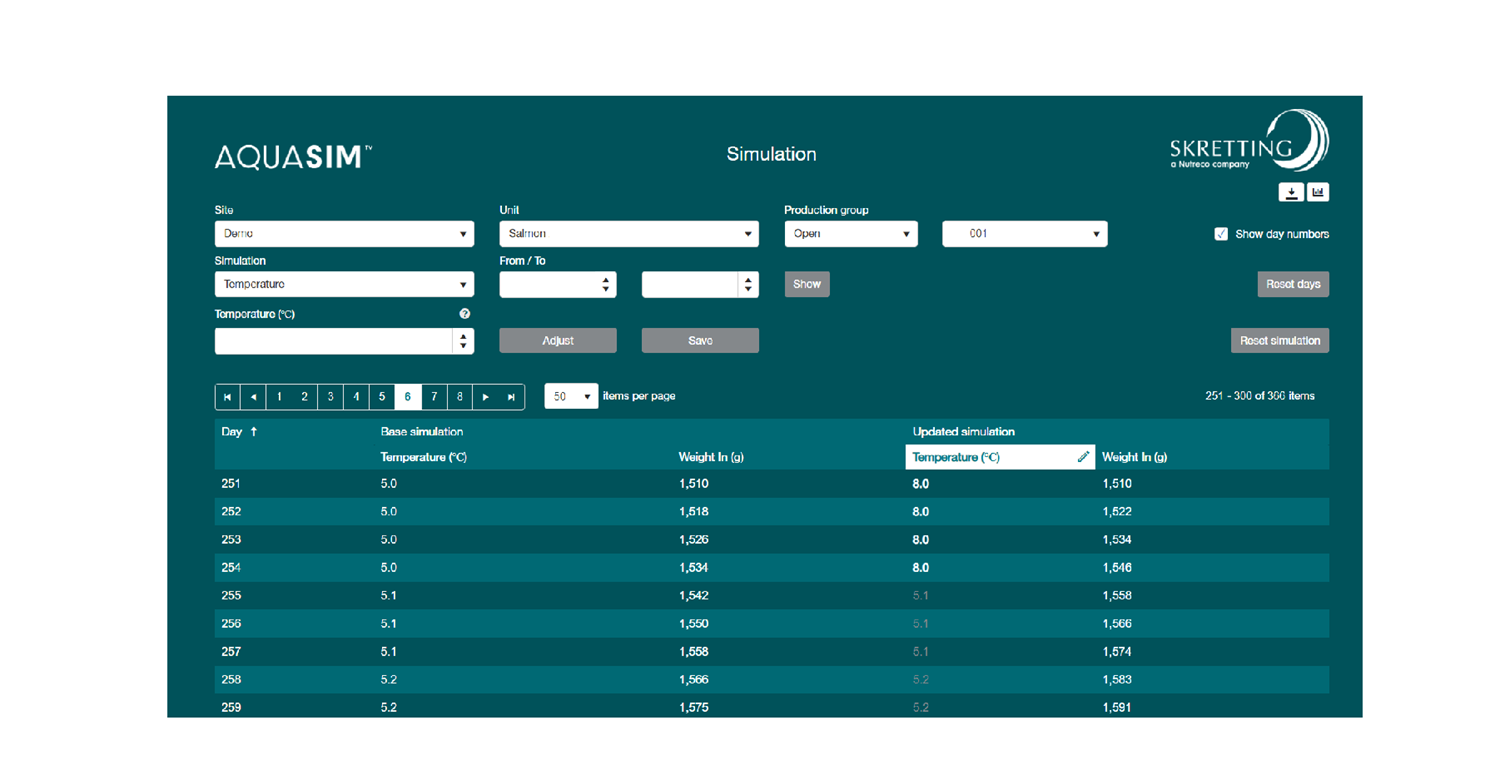
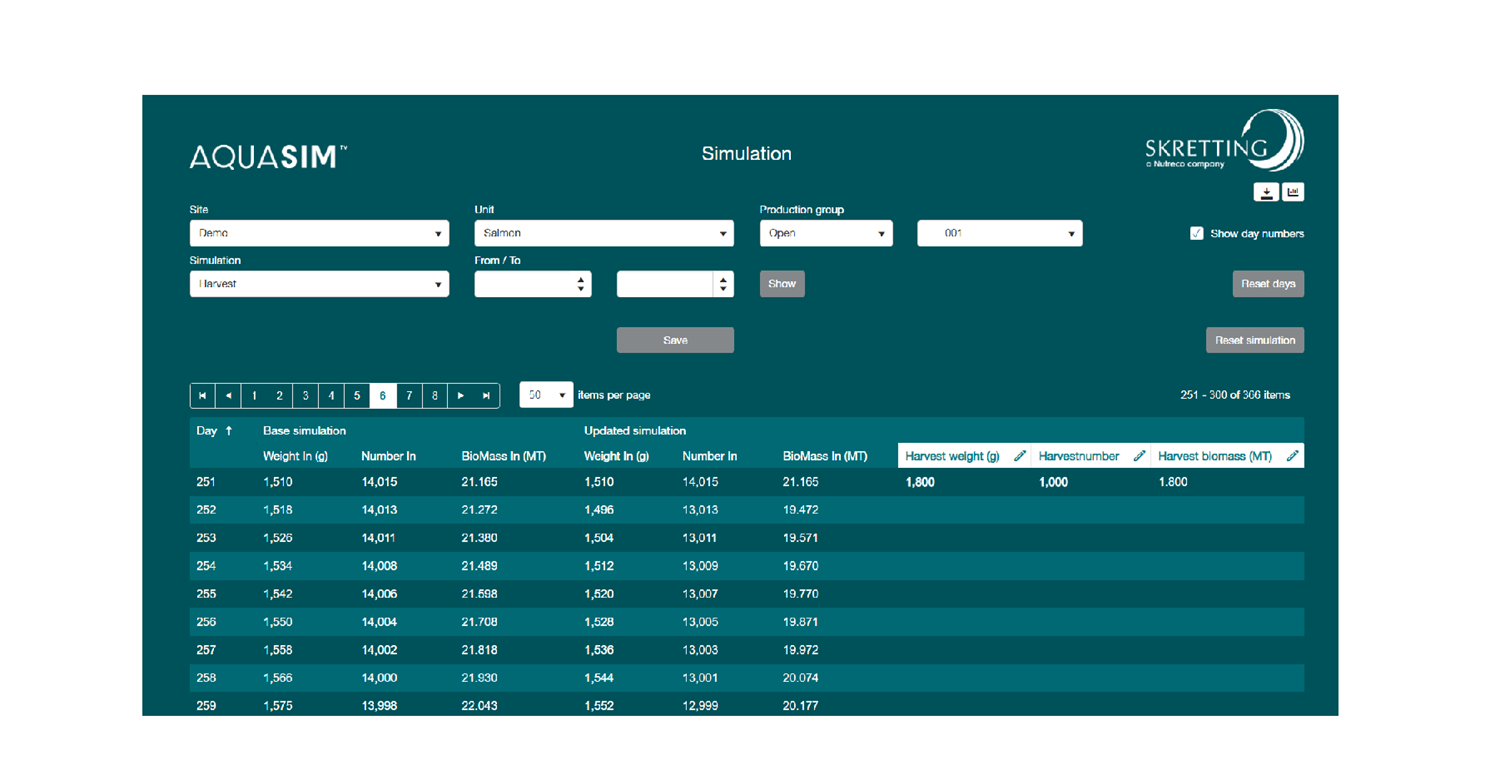
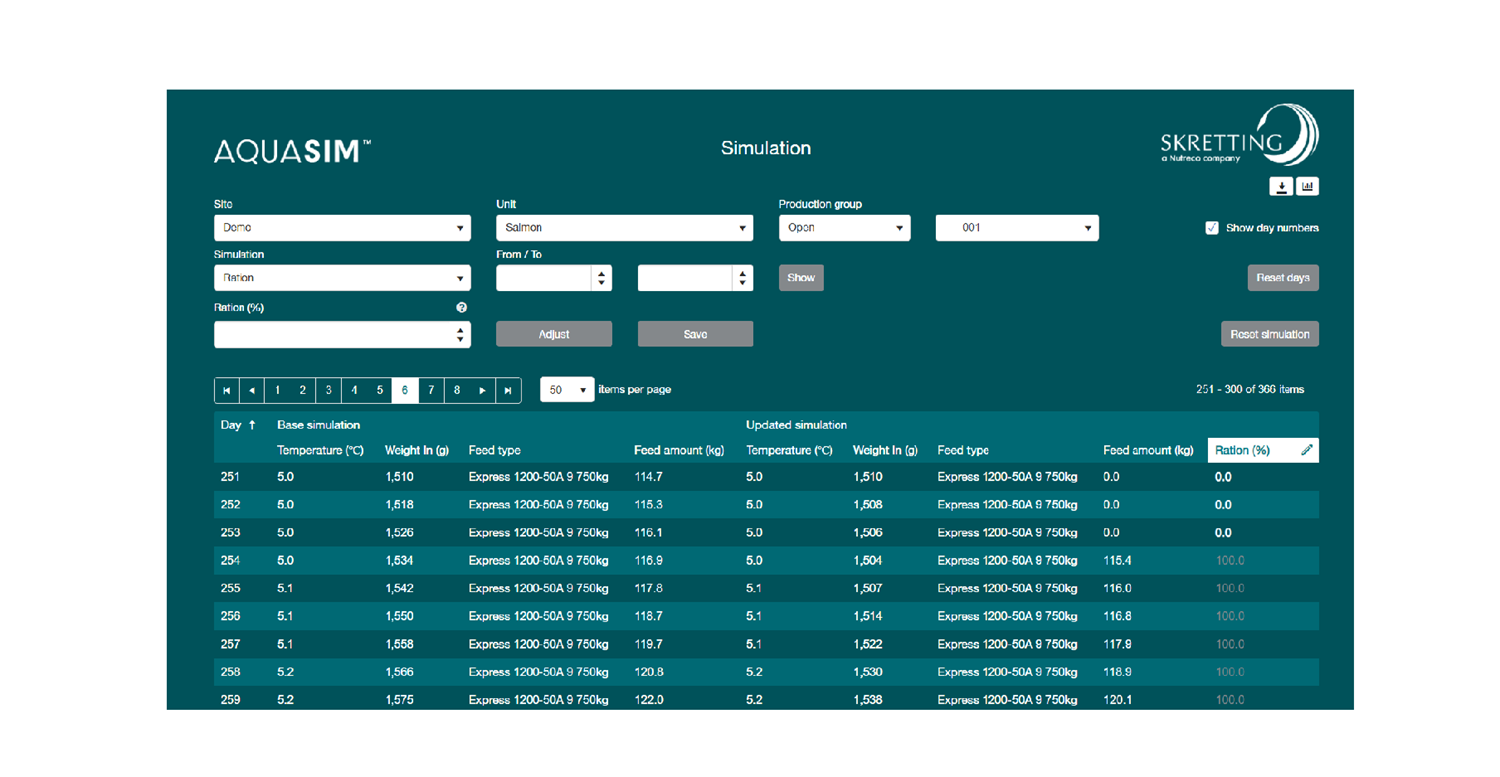
When opening a simulation, both base simulation (left) and updated simulation (right) will be shown in the grid. The base simulation is based on the setting in 'My site' module, and would not change, so it serves as a baseline for comparison. The pencil at the column of updated simulation indicates that this column is editable. In the simulation grid, the default value from site setting and model is coloured in grey meaning it's the same as base simulation, while the value in bold white means it has been updated. There are two ways to edit data in the simulation module. It is easy to update data for a period of time in the field, while making changes for each individual data in the grid. 

To use the field, first choose the time range, and then put in the data in the field, click 'Adjust'. The red triangle at top left corner of each cell indicates that the data in this cell has been updated but not yet saved. Check these updated values in grid: if OK, click 'Save'; otherwise, make changes to data in the cell and then click 'Save'. All the updated values will be shown in bold white. To reset simulation, click 'Reset simulation' for the type of simulation and the period of time you're currently working on, then the updated simulation will be reset back to base simulation.

Edit simulation.png

Simulation types

RGI (Relative Growth Index) is the ratio between actual growth and expected growth, meaning the higher the RGI is, the better animals grow.

There are two kinds of RGI: feed RGI and RGI. Feed RGI is predefined for each feed, so it cannot be changed. But if you know animals grow better than the weight in of base simulation, you could adjust RGI to higher. For example, when RGI is adjusted to 110%, the weight in of updated simulation is higher than the ones in base simulation. The changes in RGI simulation will influence the simulation graphs of growth and daily feed amount.

FCI (Feed Conversion Index) is the ratio between actual feed conversion and expected feed conversion, meaning the lower the FCI is, the better feed conversion rate (FCR) the animals have. For example, when you know this production group has lower FCR than the expected FCR in the base simulation, you could adjust the FCI to 90% to make sure the feed amount is more accurate. The changes in FCI simulation will influence the simulation graph of daily feed amount.

In feed type simulation, you can adjust the diet used in the production cycle. All the feed applicable for this particular species in this country are available in the drop down menu. The changes in feed type simulation may influence the simulation graphs of growth and daily feed amount due to different feed RGI and FCI of different feeds types.

For mortality simulation, you can use the drop down menu to choose to adjust daily mortality percentage or number. The pencil indicates the editable column and the other column will be updated accordingly based on the input. For example, when type in 1% daily mortality for this period, daily mortality is calculated and updated accordingly; and vice versa. The changes in mortality simulation will influence the simulation graphs of number in and daily feed amount.

Temperature could affect the growth for all species, so you could update the temperature in the simulation module if you know already it is different from temperature profile. The changes in temperature simulation will influence the simulation graphs of temperature and growth as well as daily feed amount.

In harvest simulation, users can register planned harvest in the future and thus have more accurate feed forecast. There are three editable columns in harvest simulation. At least two out of the three parameters need to be filled in. If filled in two, the other one will be automatically calculated. The changes in harvest simulation will influence the simulation graphs of number in and daily feed amount.

Ration is the percentage of the recommended daily feed amount that will be given to the animals. The updates in the ration simulation would provide more accurate feed forecast in periods with planned starvation and over/underfeeding. For example, ration of 0% is starving the animals while ration of 150% is overfeeding which results in high FCR but no effect on growth. The changes in ration simulation will influence the simulation graphs of growth and daily feed amount.