
The footprint of our products over their life cycle
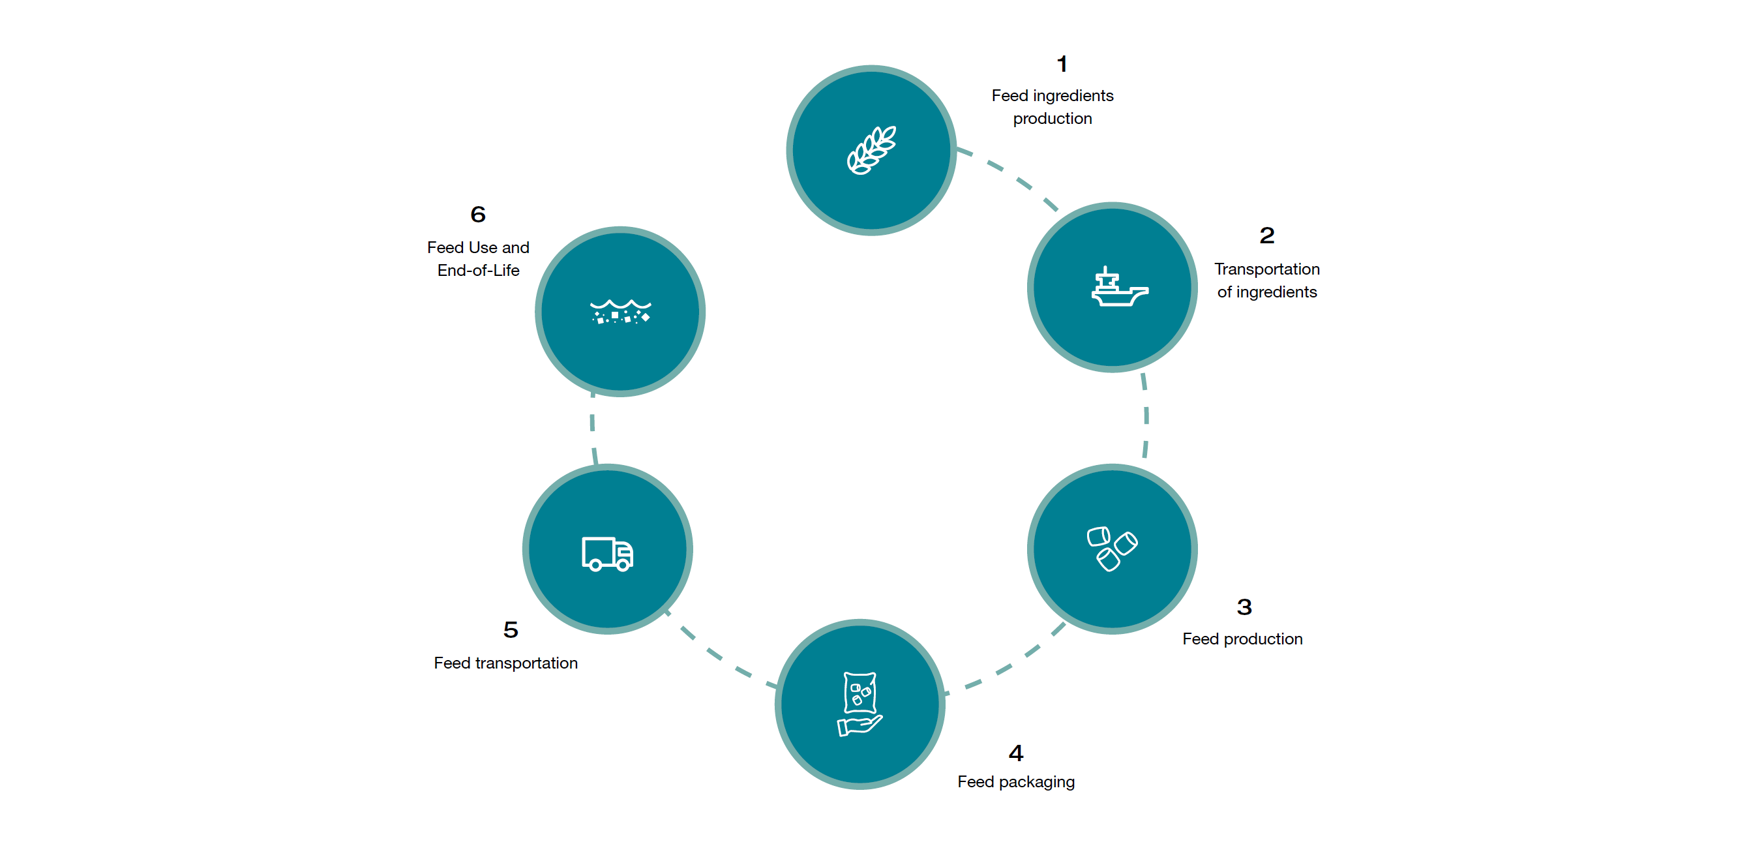
We decided to implement the LCA method to quantify in a robust and standardised way the environmental impacts of our products and organisation. Following the life cycle thinking principle, we also account for the emissions upstream and downstream our own gates. In the following description, we will have a closer look at the core life cycle stages of our main products: fish/shrimp feed. Our products principally go through the following main life cycle stages, which we will explain deeper.
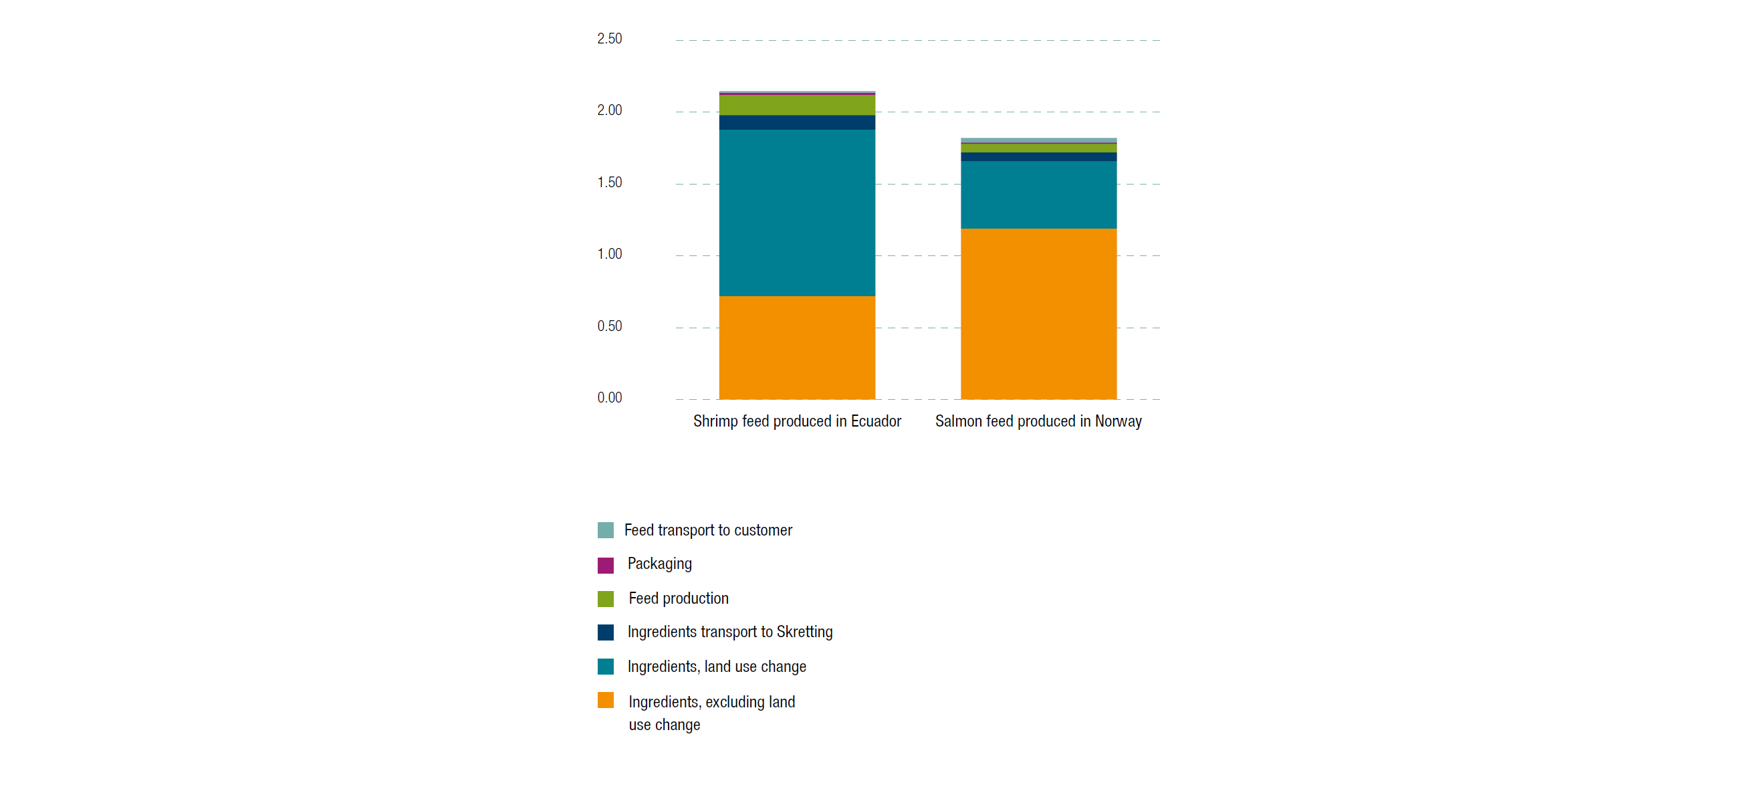
Based on the calculated carbon footprints of two exemplary feeds, a salmon feed produced in Norway and a shrimp feed produced in Ecuador (see below), we will also explain the core drivers behind the carbon footprints over the different life cycle stages for these specific cases and what causes differences.
Life Cycle Stage I: Feed Ingredients
General description
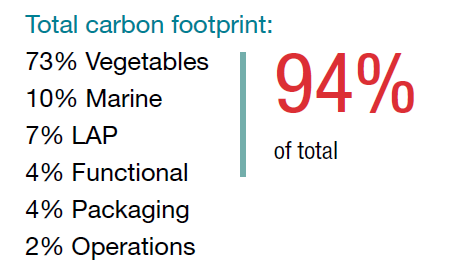 The largest share of the feed footprint is linked to the feed ingredients. For Skretting in total but also for most of our products, more than 90% of the footprint is caused upstream of our gates. This is a challenge because we only have indirect influence on this part. For example, we cannot directly determine which energy source our suppliers shall use or how farmers even further up the value chain cultivate their fields.
However, at the same time, we see this as an opportunity. Knowing about this hotspot allows us to focus more energy on our procurement, integrating environmental metrics in procurement systems and, based on this, define clear sustainability targets for our purchasing teams. With this, we have a great chance to significantly drive the reduction of the footprint of the whole feed and fish/shrimp value chain.
Quantifying and understanding the ingredient’s footprint is not easy though, as there is a high diversity of feed ingredients, an even higher range of production processes and thus, potential environmental impacts linked to them. Next to this, as we do not have direct influence over these processes and access to primary data is currently limited, we need to rely mainly on average secondary data. This comes with uncertainties that need to be known and understood to improve data quality but also to not draw wrong (and probably expensive) conclusions based on weak data.
Based on carbon footprint analyses we did on the organisational level and for different feeds over the past year, we learned that the ingredient’s footprint is mainly driven by vegetable ingredients. This is mainly, but not only, due to land use change effects.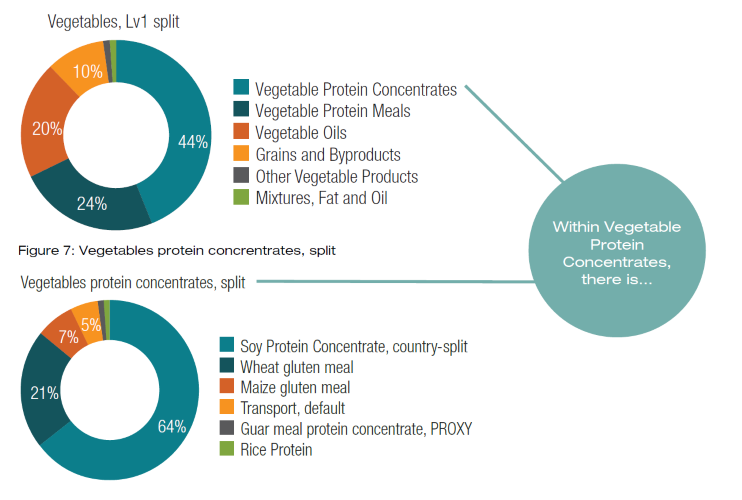
According to current LCA standards, greenhouse gas emissions linked to direct land use change (dLUC), which means the transformation of for example forest or grassland to cropland, has to be considered when it happened within the last 20 years. Land transformation can lead to significant environmental impacts, for example due to the cutting (and thus the loss) of biomass (above-ground but also below-ground like roots) and especially also due to the following change of soil carbon pools while adapting to the new situation.
These emissions can last for many years after the land has been actually transformed.
Deforestation is a global problem that also drives the carbon footprint of some important feed ingredients, like soy. Soy per se is an efficient crop that can have a smaller footprint (without land use change) than many other crops because of its ability to fix nitrogen from the air, which reduces the need for fertiliser. It can also be grown on land that is not suitable for many other crops. However, the demand of soy increased significantly in the past which also evidently caused deforestation, for example in the Amazon. As stated in our Soy & Oil Palm Ingredients Sourcing Policy, Nutreco is committed to facilitate the complete removal of any deforestation risk in our supply chains by 2025.
Despite reducing the land use change part, we are also exploring lower footprint ingredients across all categories. Even without land use change, vegetable ingredients, same as others, come with a footprint attached to them. Based on our database we are already identifying lower carbon ingredients per and across categories.
We will focus more on by-product ingredients, for example in the land-animal or marine ingredient categories. We also validate different novel ingredients regarding their footprints, availabilities and which conventional ingredients they might be able to replace within the different ingredient categories. Based on this information we will calculate realistic footprint reduction scenarios. It is not to forget that also novel ingredients have a footprint attached to them and that they have to be carefully validated to not move into a wrong direction.
Our core challenges
One of our current main challenges is, that despite making good progress on buying only certified ingredients if they are coming from high-risk countries, as most certification schemes can only guarantee deforestation-free since for example 2008 or 2009, we still have to count in the whole land use change related footprint due to the 20-year cut-off date required by footprint standards. Hence, the footprint of certified deforestation-free crops is as high as the ones from uncertified crops, despite the clear environmental benefit of buying certified. To address this challenge, we are specifically engaging certification bodies to provide more primary data aligned with the international footprint standards. Additionally, we are engaging in working groups to discuss this topic on a higher level, as we are not the only company that is facing this challenge.
Next to this, we are mainly forced to calculate with secondary data, while this can only reflect supplier specific footprints to a limited extent and thus adds significant uncertainty. Using secondary data for scope 3 is allowed by the footprint standards, but limits decision making for procurement and feed formulation. On the other hand, for most novel ingredients, due to being novel, there is yet no good and quality-approved secondary LCA data available. We have thus already requested primary footprint data from over 20 novel ingredient producers. To understand these footprints and validate their quality and consistency is an ongoing task. We already see that most of the presented values are not comparable due to different choices made in the calculations. We are thus now requiring novel ingredient suppliers to calculate according to consistent rules as given by the PEFCR Feed standard. In a next step we want to actively calculate reduction potentials via different scenarios for replacing specific conventional ingredients gradually with novel ingredients or other lower carbon alternatives.
Feed example
For both feeds presented in page 26, the highest carbon footprint share is related to the feed ingredients. The highest impacts come from the vegetables, for example due to agricultural practices such as tilling of the soil or fertilisation. In addition, further processing steps, for example drying of the crops or protein/oil extraction contribute to the footprint.
As can be further seen in the charts, land use change related emissions make a big part of the overall feed carbon footprint. This is mainly linked to vegetable, especially soy ingredients sourced from countries with high risk for deforestation. For some of our OpCos, for example Skretting Norway, this goal is already achieved. Despite only sourcing either from low-risk countries or class A certified deforestation-free soy from high-risk countries, there is still a significant land use change share visible in the salmon feed footprint. This is due to the 20-years cut-off date defined by footprinting standards while most current certification schemes only guarantee deforestation-free for up to 14 years. With our deforestation-free soy and palm oil sourcing policy we directly address the reduction of the land use change footprint but still need to count in land use change effects until the 20-years cut-off date is reached.
Despite vegetable ingredients, also other feed ingredients add to the footprint, for example marine ingredients or land animal-based proteins due to different kinds of production and processing steps. Marine ingredients and ingredients from by-products have a rather low specific carbon footprint, so that feeds with high inclusion levels of these ingredients have a generally lower absolute carbon footprint.
Life Cycle Stage II & V: Ingredients and feed transportation (inbound and outbound logistics)
General description
The carbon footprint caused by transportation (either the transportation of the ingredients to our plants or the feed from our plants to our customers) has a rather low share in the overall feed carbon footprint. Despite the general assumption of high impacts caused by transportation over long distances, it often is more sustainable to source lower footprint ingredients from overseas than sourcing local ingredients with less sustainable techniques to produce them (for example, due to other land management practices, lower yields, higher fertiliser use etc.). The best case of course, however, would be to source low footprint ingredients locally, but this sometimes is limited by cost or availability. The footprint of transportation is mainly influenced by transportation distance, the mode of transport, fuel type and consumption, and the load factor. Due to high freight capacities and load factors, container transport via ship generally comes with a significantly lower carbon footprint per ton-kilometre compared to a transport via truck.
Even though the impact on the overall feed footprint is low, Skretting still looks for opportunities to lower the footprint of transportation. One aspect is to focus on more local sourcing, in case of ingredients with similar or lower carbon footprint values. Another one is collaborations for increasing the loading factor/efficiency of transport of our feed to farms, where possible (read story about Fjordfrende in our 2019 Sustainability Report).
Our core challenges
For calculating more specific and automated the inbound transport impact, information on sourcing regions needs to become available in our different systems. This challenge was already mentioned for the feed ingredients, and it will be one main focus area for the year to come as it also helps us to more accurately calculate the impact of inbound logistics. Until now, aligned with the PEF standard, we are mostly calculating with default factors for intra- and intercontinental transport. Same relates to tracking information regarding mode of transport and loading factors for all the ingredients that arrive at our factory gates.
Feed example
For the feed examples one can see a slightly higher impact for inbound transport for the shrimp feed compared to the salmon feed. This is because more ingredients with high inclusion levels are sourced from a different continent by the Ecuador plant (for example, wheat and soybean meal from USA) compared to the Norwegian plant, which causes longer transportation distances and often requires multi-modal transport. Overall, the transportation impact is low compared to the ingredient footprint but still needs to be addressed, for example by sourcing more ingredients locally or selecting less impactful transportation modes.
Life Cycle Stage III: Feed production
General description
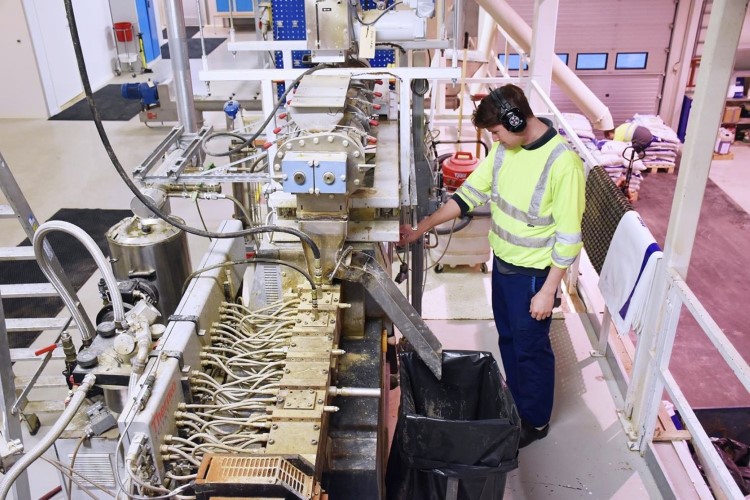
Feed production demands electrical energy to run all motors in our factories or fuel combustion for steam generation, heating air for drying, or simply to accelerate the forklifts in our warehouses. Depending on the energy efficiency, fuel type or the electricity source, the footprint linked to feed manufacturing can be higher or lower between the mills. Other than the footprint attached to the feed ingredients, this is something under our direct control and that is why we also have best quality (primary) data available to calculate the footprint from our operations and to implement strategies to reduce it.
The focus of Skretting is to reduce specific energy consumption (kWh/t of feed) and consequently reduce the emissions and production costs. This topic has been on our agenda in 2021, where most of our plants reduced kWh/t, and it is in the highest focus for 2022. Improving energy efficiency is done by optimising our dryers and boilers, looking into operational regime to reduce stops and start-ups of the plants, insulating equipment and continuous checking and fixing steam and compressed air leakages, etc. Also, we are switching to green electricity and fuels wherever is available. More about activities within operations can be seen on page 33 (Improving our own operations).
Our core challenges
Availability and stability of supply of green(er) fuels and electricity in some regions are the key challenges for achieving a significant drop in emissions. For example, in Ecuador we have already switched to completely green electricity. However, replacing heavy fuel oil used in boilers is way more difficult to do, because the gas supply is not stable, and the electrical system is not robust enough to support converting our dryers and boilers into electrical. Ecuadorian team has already presented a plan for gradual replacement of heavy fuel oil that will be completely removed from our operations latest by 2030.
Feed example
As can be seen in the footprint example, compared to the ingredient footprint, the share linked to manufacturing is low, but still can be significant. The shrimp feed produced in Ecuador has a higher production footprint than the salmon feed produced in Norway. This is related to the energy mix, which in Norway comes with a significant higher share of renewable energy, and thus a lower carbon footprint per kWh. Another reason is the difference in amount of energy needed to produce a ton of salmon versus ton of shrimp feed. Shrimp feed production process is more energy intensive than salmon feed production due to finer grinding and higher feed density that makes it more difficult to dry.
Life Cycle Stage IV: Feed packaging
General description
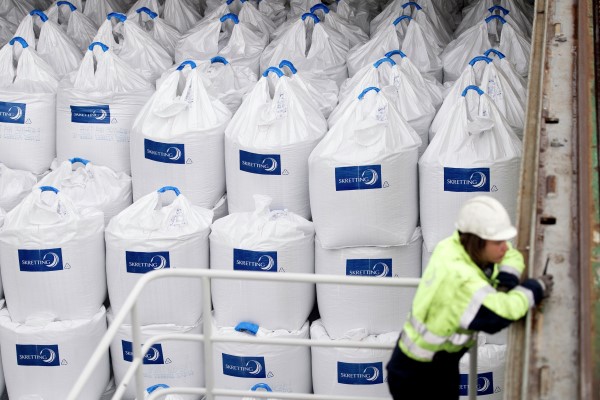
Feed packaging also has a generally low contribution to the overall feed footprint. Still sustainable packaging is an important topic to address as it can have a significant impact on the environment in the bigger picture (same as transportation).
For the main packaging types used within Nutreco, we have calculated the footprint metrics and introduced them into our database. This allows us to calculate the footprint of the feed packaging and optimise them having the footprint in mind also more specifically.
We are principally following the good waste management hierarchy and look for solution to;
- Reduce packaging (for example, by using bulk transport or big bags instead of smaller packaging sizes),
- Increase the recyclability of packaging and recycled content of packaging materials and,
- If packaging needs to become waste, we committed to send zero waste to landfills.
Our core challenges
Material reduction and design for circularity are the main challenges we are facing. To achieve the first goal we are looking at the most material efficient solution in our portfolio for each situation. This can be done by packing more efficiently or reducing the thickness of our bags. The challenge is to find a balance between functionality and ideal packaging weight. We are reviewing our portfolio to find the optimal bag for every situation.
The second challenge is the use of multi-material packaging. This type of packaging provides specific functionality, but it limits recyclability. The challenge is the move towards mono-material packaging wherever possible. Food and feed safety restrictions prevents us from using recycled materials as a direct feed contact material. However, the packaging material we put on the recycling market can increasingly be used in non-food applications.
Example
The footprint of the shrimp packaging in the example is slightly higher than the footprint of the salmon feed packaging. In the example case, the shrimp feed is packed in 25 kg woven PP bags, while the salmon feed is packed in big bags that carry approximately 750 kg feed. Mainly due to the higher carrying capacity, the footprint per kg feed is lower for the big bag, or in other words packaging is avoided via using larger bags. It depends on the ability of our customers to accept this larger packaging. The footprint of packaging can be further reduced by using more recycled material or increasing recyclability of packaging whenever the situation permits.
Life Cycle Stage VI: Feed Use and End-of-Life
General description
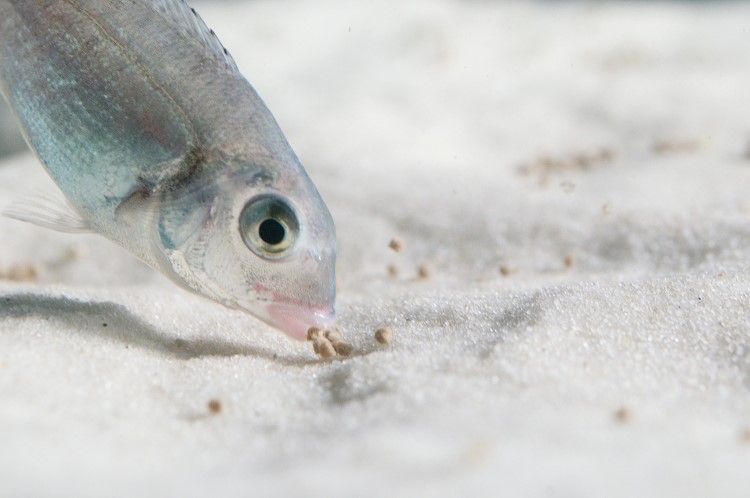
With our current tools we are mostly able to calculate the footprint per kg feed from cradle to gate. However, this reflects only a part of the feed life cycle. The function of fish/shrimp feed is to feed the animals. The more efficient the feed can be taken up and digested by the fish and shrimp, the lower are the feed related impacts in the whole value chain. As well, feed can improve fish/shrimp health and thus lowering mortality. These aspects need to be considered, following a life cycle perspective, as even higher per kg feed footprints might result in lower overall fish/shrimp footprints.
At the moment, we focused our efforts on setting up LCA metrics and calculations for cradle-to-gate assessments, as this is what is mainly requested by our customers and guided by recent industry standards. This also helped us to get started on our LCA journey before focusing on the whole complexity of the full value chain. However, on this basis, we now want to step up and extend our calculations and systems gradually to also include downstream impacts. For this, we are looking for collaborations with our customers as this demands joint efforts and robust calculations require the share of primary data between both sites. The new PEFCR for Marine Fish can provide a great opportunity to further align LCA calculations, as it also ties in with the PEFCR Feed.
Feed example
This life cycle stage is not considered in the presented footprint calculations of the exemplary feeds, as these are generally cradle-to-gate assessments as demanded by for example the PEFCR Feed standard. Together with our customers we are aiming to gradually extend calculations to get the full picture, ie including feed related impacts happening at the fish/shrimp farm.

Next
Scope 1, 2 and 3 emissions
To achieve our Science Based Targets commitment, and grow at the same time, Skretting needs to take every single opportunity for CO2e reduction – improving energy efficiency, switching to alternative, less polluting fuel sources, and purchasing renewable electricity wherever is possible.