
Emissions 2025
Below in this text we present the data for our greenhouse gas (GHG) emissions calculated in CO2 equivalents (CO2eq) as internationally standardized unit for carbon footprints, and the environmental impact of our operations plus the nutrient release of nitrogen and phosphorus. Method descriptions for various calculations can be found here.
The total absolute emissions of greenhouse gases from cradle-to-gate for Skretting Norway increased by 7.6 percent in 2025 from 2024, while the carbon footprint of one kg of feed was up by only 0.8 percent from the previous year. This indicates that the emission increase in absolute terms is mainly related to higher feed production volumes rather than an increase of the feed carbon footprint — a dilemma that many companies face.
While we made progress on e.g. collecting more representative supplier footprint data in 2025, slight changes in the average raw material inclusion but also changes in the countries of primary production of especially vegetable crops have offset these achievements. Absolute scope 1 emissions also increased by ca. 11.2% in 2025 vs. 2024, which is also linked to increased production. Scope 2 emissions were already eliminated in 2024 where we started to only purchase green electricity for all our production activities, which we continued in 2025.
The total absolute emissions over all three scopes in 2025 were 960,811 tonnes CO2eq (plus 7.6 percent from the previous year). In the same period our production increased by 6.7 percent, which is the main cause of the emission increase. The average carbon footprint per kg feed from cradle-to-gate had an emission factor of 1.43 kg CO2eq per kg feed (plus 0.8 percent from the previous year).
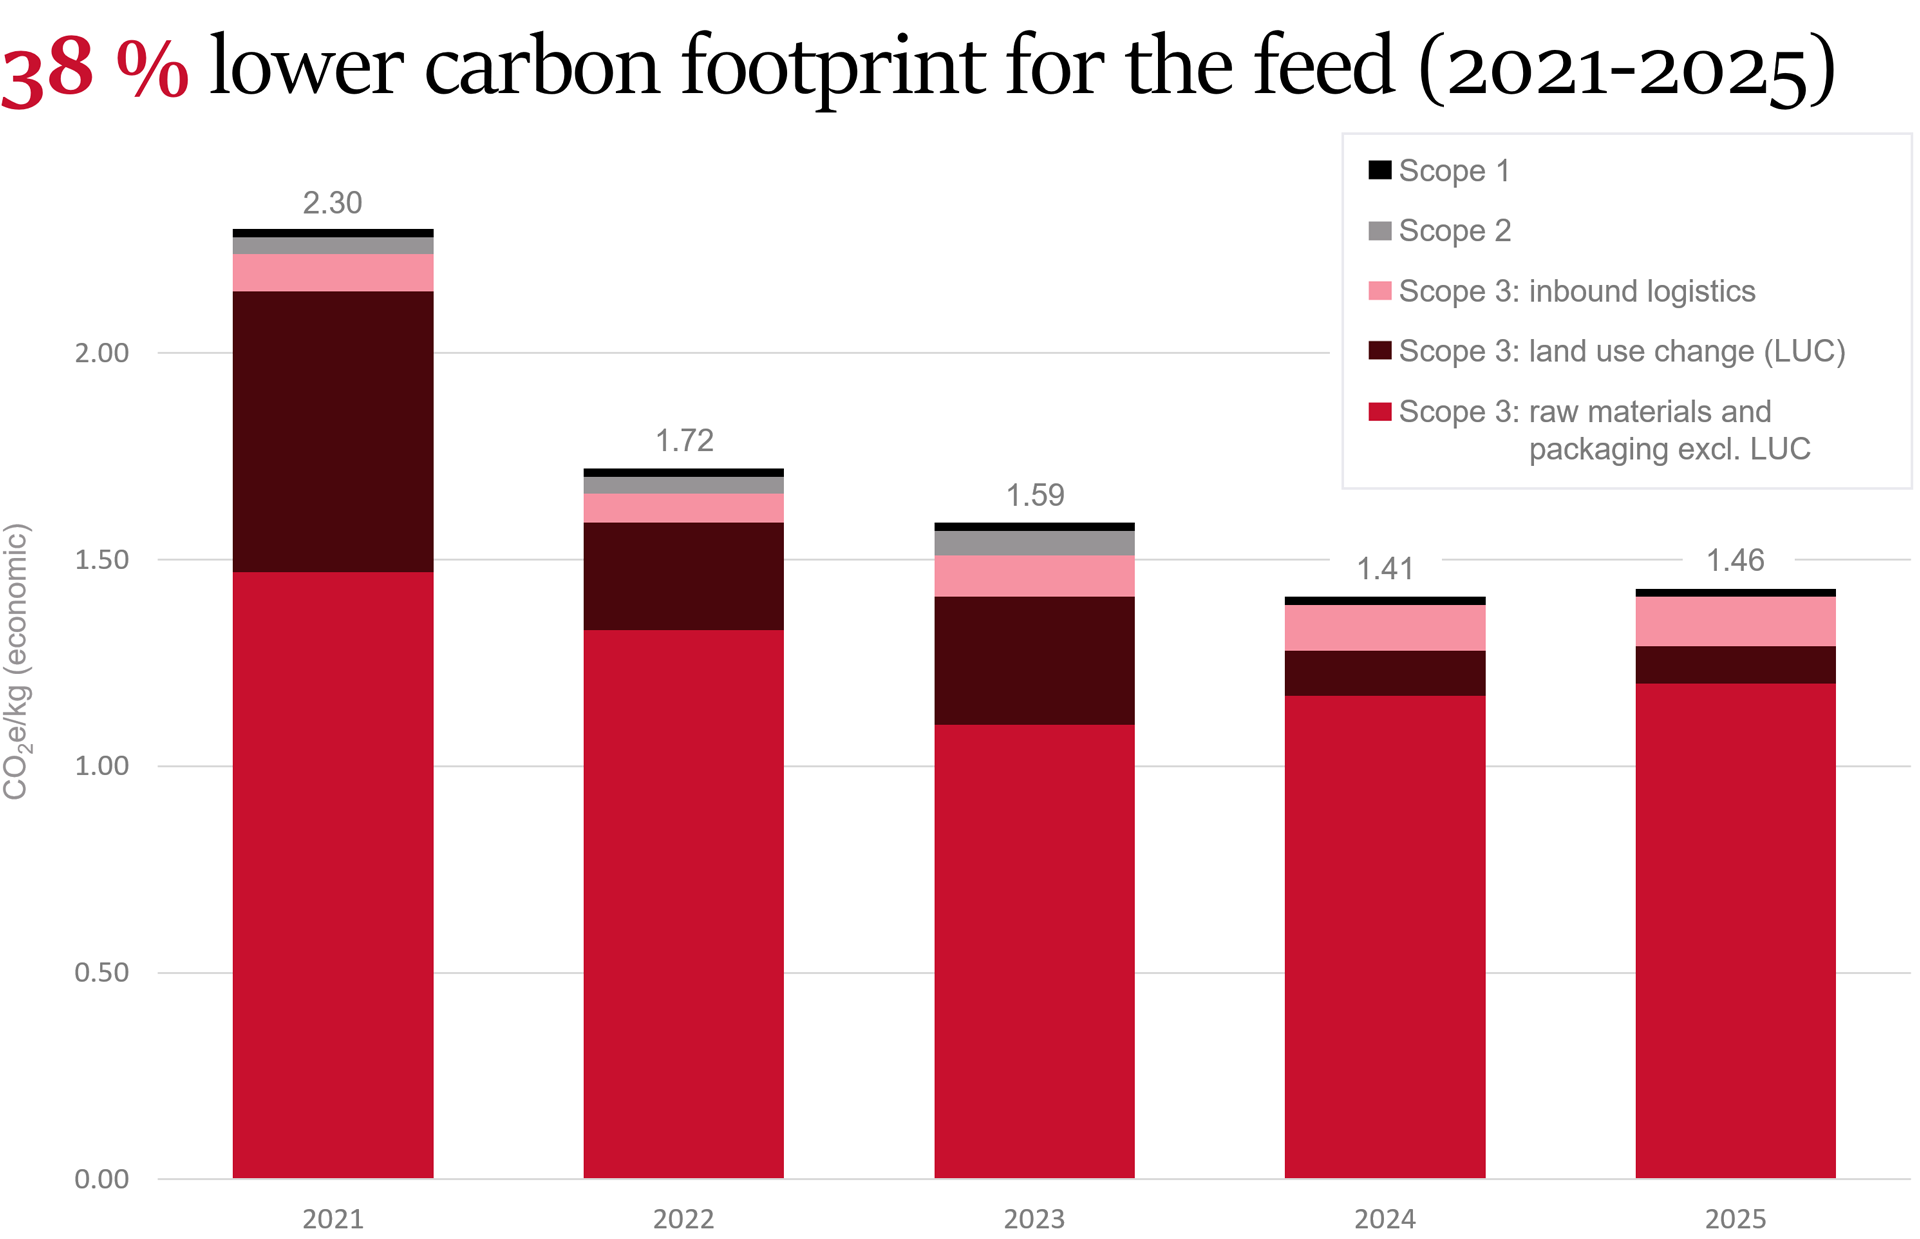
The average carbon footprint (kg CO2eq) for 1 kg of feed at factory gate is 38 percent lower than 2021. This is mainly due to the ingredients (change of raw materials, inclusions and sourcing countries), but we have also switched from natural gas to electricity for some of our own internal operations, thus reducing our scope 1. From 2024 we decided to only use green electricity and started to purchase certificate of origin for all the electricity we use—in effect eliminating scope 2.
We are planning to update our SBTi targets and will most likely change the baseline year from 2018 to 2022 or 2025. The greenhouse gas (kg CO2eq/kg) reduction from 2022 to 2025 is 17 percent for our feed. Feed is the major part of a salmon's scope 3.
Shortcuts to the emission tables on this page
- Skretting Norway greenhouse gas emissions per kg of feed produced (kg CO2eq)
- Skretting Norway greenhouse gas emissions in absolute numbers (tonne CO2eq)
- FLAG Breakdown of scope 3 (kg CO2eq) per kg feed
- Energy consumption, water and waste in operations
From 2024 we decided to only use green electricity, accepting the cost of certificates of origin and reducing our scope 2 to zero
We continued with this practice in 2025. Since scope 2 can be practically eliminated by only purchasing green electricity, we decided to make this move in 2024 to only purchase electricity with certificates of origin. That is why our scope 2 is zero from 2024.
This business decision increased the production cost, but we truly believe that this was the right decision to do. Especially when moving from fossil fuels to electricity in Norway can increase your overall emissions.
In 2023 our own emissions increased when we transferred one of our boilers at the plant in Averøy from natural gas to electricity. To some this might seem strange, that emissions increase when you go from the fossil fuel natural gas to electricity. Especially since most of Norway’s electricity production is renewable energy coming from hydropower generators.
But Norway is part of the European electricity grid where electricity could be generated from fossil fuels like coal or gas. This results that electricity in Norway has a larger emission factor than natural gas since we must use market-based calculation for scope 2 and not location-based emissions factors (as mandated by Norwegian governments). By purchasing green electricity with certificates, this is now solved as also with market-based accounting no electricity grid emission factor needs to be applied any longer.
Scope 3 will continue to go down, but it will be harder to make this happen
From we when started with detailed emission reporting in 2018, our scope 3 has been substantially reduced as we collaborated with suppliers in partnership with our customers. But to further reduce absolute emissions while producing more feed requires additional efforts.
The major reduction in scope 3 from 2021 is partly due to a shift in the raw materials we use, but it is mainly because our suppliers that have performed their own life cycle assessments (LCA) have identified important hot spots in their production and value chain and have worked hard to reduce their emissions or could prove via primary data what they already achieved. The reduction in land use change (LUC) emissions has been the biggest driver. Moving forward we expect the LUC to continue to decrease, but we expect to use more low emission ingredients and that our suppliers will continue to reduce their greenhouse gas emissions.
Several of our customers have set their own ambitious Science Based Targets (SBT). Since their footprint mainly comes from feed, we must deliver major reductions for the feed to actively help them meet their sustainability targets. Since we have several long-term partnership contracts with major salmon producers, this enables us to make commitments to our responsible suppliers, strengthening the sustainable foundation of the value chain.
We also see that we have a special responsibility to act as we are positioned in the middle of the value chain, and we probably have the best opportunity to build connections end ensure transparency for all stakeholders in the seafood value chain. We can create incentives for farmers so they can rely on us as a key contributor to help them reach their targets.
A key challenge for scope 3 is to reduce also absolute emissions while growing the business. Even though we made significant progress to reduce the feed specific footprints over the past years, with increased production volumes and hence, increased raw material volumes, the absolute emissions increased from last year. This means that even more effort is needed in order to decouple impact from growth.
Traditional reduction pathways and levers are likely not enough to achieve that. That is why we are actively looking into innovative actions, such as regenerative agriculture.
Especially in supply chains where a lot has been done already to eliminated land use change emissions, to achieve further reductions, active and permanent carbon sequestration will become essential. In 2025, we have started to build an understanding of what regenerative agriculture means and what potential it has. In 2026, we are planning to increase our knowledge even further by getting involved in a pilot project to learn the practicalities.
Science based targets initiative (SBTi)
Through our mother company Nutreco, Skretting committed early on to the science-based target initiative (SBTi) with a 30 % reduction of CO2eq for scope 1 and 2, and a 39 % reduction for scope 3 towards 2030 with 2018 as the baseline year. We expect our SBTi targets to soon be updated according to the new Land Sector and Removal Guidance, which requires to define emission reduction targets for both, FLAG (meaning emissions linked to forest, land and agriculture) and non-FLAG (other emissions, e.g. by fossil energy use or other industrial processes) emissions.
The impact of feed
Feed plays an essential role in ensuring the health and wellbeing of farmed fish and can greatly improve the efficiency of the aquaculture process. While gains are made in optimising feed efficiency, feed also contributes one of the biggest environmental impacts.
We will continue to improve our own operations (scope 1 and 2), but the main footprint of feed comes from the raw materials we use. So, to further reduce our footprint our reduction strategy can be dived into three main areas:
1) Move to low carbon ingredients
We will replace ingredients with a high carbon footprints and high volume with low footprint ingredients by using circular ingredients, novel ingredients and ‘conventional’ low impact ingredients. This potential is already demonstrated in several cases.
2) Land use reduction
A major part of our GHG emissions is due to land use change, and this will be reduced. Land transformation affects carbon stocks and can result in carbon emitted that was stored in soil or plants (e.g. deforestation). That is why we have demanded that our suppliers of soy protein concentrate (SPC) from Brazilian beans must commit to a soy supply chain free from illegal and /or legal deforestation and conversion, using a cut-off date of August 2020, which they have all accepted.
We also encourage our suppliers to monitor and verify if their farmers have not done any deforestation or conversion for the past 20 years, as is the 20-year amortization period for the standardized calculation method based on PAS-2050. This has been a major contributing factor for the massive improvement from 2020 as with primary data and related proof (e.g. via satellite images) of deforestation and conversion-free supply for min. 20 years, the land use chance emissions dropped significantly.
However, not only soy but also other vegetable crops have land use change related emissions in their footprints. These might be related to grassland conversion or conversion of other croplands, which also happens within Europe. Supplier engagement but also a potential switch to other sourcing regions can play a key role in also reducing these emissions.
3) Supplier engagement
We truly believe in supplier engagement to fight the climate crisis. That is why we will continue to engage with our suppliers to collect and reduce GHG emissions in our supply chain. We will ask them to commit to the Science Based Target initiative because that will level the playing field since we will have the same goals using the same language. In addition, we will push to get primary data for products so we can learn from each other, gain a deeper understanding of the supply chain and robustly quantify any emission reductions. We will be a knowledgeable partner for both suppliers and customers, adding value to their reduction journey.
Greenhouse gas emissions of Skretting Norway's fish feed
Skretting Norway greenhouse gas emissions per kg of feed produced (kg CO2eq) economic allocated with LUC*
|
2025 |
2024 |
2023 |
2022 |
2021 |
|
|
Scope 1 |
0.02 |
0.02 |
0.02 |
0.02 |
0.02 |
|
Scope 2 |
0.00 |
0.00 |
0.06 |
0.04 |
0.04 |
|
Scope 3 |
1.41 |
1.39 |
1.51 |
1.66 |
2.24 |
|
Total CO2eq per 1 kg feed |
1.43 |
1.41 |
1.59 |
1.72 |
2.30 |
* The LUC and economic allocation is in line with the PEFCR standard
** A market-based calculation for electricity is used for every year. From 2024 we started to purchase certificate of origin for all the electricity we use, that is why our scope 2 is zero for 2024 and 2025.
*** Scope 3 for the period 2020-2023 has been recalculated in 2024 compared to numbers reported in previous footprint and impact reports due to the introduction of new primary data received in 2024 for guar meal and salmon oil.
Skretting Norway greenhouse gas emissions in absolute numbers (tonne CO2eq) economic allocated with LUC*
|
2025 |
2024 |
2023 |
2022 |
2021 |
|
|
Scope 1 |
11,918 |
10,663 |
10,850 |
13,082 |
13,211 |
|
Scope 2 |
0 |
0 |
37,602 |
23,636 |
23,960 |
|
Scope 3 |
948,893 |
882,315 |
914,301 |
980,193 |
1,317,355 |
|
Total absolute tonne CO2eq |
960,811 |
892,979 |
962,753 |
1,016,911 |
1,354,526 |
* The LUC and economic allocation is in line with the PEFCR standard
** A market-based calculation for electricity is used for every year. From 2024 we started to purchase certificate of origin for all the electricity we use, that is why our scope 2 is zero for 2024 and 2025. The increase in scope 2 from 2022 to 2023 and the decrease in scope 1, is because one of our boilers at the plant in Averøy was transformed from natural gas to electricity mid 2023. Since we use market-based calculation for scope 2 and not location-based, electricity in Norway has a larger emission factor than natural gas. So our absolute emissions actually increased when we went from fossil natural gas to electricity.
*** Scope 3 for the period 2020-2023 has been recalculated in 2024 compared to numbers reported in previous footprint and impact reports due to the introduction of new primary data received in 2024 for guar meal and salmon oil.
FLAG Breakdown of scope 3 (kg CO2eq) per kg feed based on SBTi FLAG guidance v1.2 March 2026
|
2025 |
2024 |
2023 |
2022 |
2021 |
|
|
[Non-FLAG] Climate change fossil† |
0.90 |
0.85 |
- |
- |
- |
|
[FLAG] Climate change LUC†† |
0.09 |
0.11 |
- |
- |
- |
|
[FLAG] Climate change land management CO2††† |
0.06 |
0.07 |
- |
- |
- |
|
[FLAG] Climate change land management non-CO2††† |
0.22 |
0.24 |
- |
- |
- |
|
[FLAG] Carbon removals and storage |
NA |
NA |
- |
- |
- |
|
[Pre-FLAG reporting] Climate change |
- |
- |
1.10 |
1.24 |
1.38 |
|
[Pre-FLAG reporting] Climate change LUC |
- |
- |
0.31 |
0.35 |
0.77 |
|
Inbound logistics |
0.12 |
0.11 |
0.10 |
0.07 |
0.09 |
|
Climate change (kg CO2 eq) (Scope 3) |
1.40 |
1.39 |
1.51 |
1.66 |
2.24 |
† Excluding LUC, peat oxidation and land management emissions
†† Including peat oxidation
††† Non-LUC land-related emissions
The table above shows clear progress on eliminating LUC emissions in our raw material supply chains.
Method description
The European Union's Product Environmental Footprint Category Rules (PEFCR) requires carbon footprint to be reported with the economic allocation method including land use change (LUC). The tables above are following this calculation method. We also use market-based calculation for electricity as this is the calculation Norwegian authorities demands from Norwegian power suppliers.
For your convenience we have included a more detailed method description on a separate page.
Click here for a more detailed method description
The environmental footprint of our operations
Skretting Norway operates in accordance with the Pollution Control Act (Act of 13 March 1981 No.6 Concerning Protection Against Pollution and Concerning Waste). Each operating plant has permits related to emissions to air, effluents to water and ground and handling of waste. Detailed description of permits for each operating plant together with historical records of emissions can be found here http://www.norskeutslipp.no/
Energy consumption, water and waste in operations
| 2025 | 2024 | 2023 | 2022 | 2021 | Unit | |
| Energy consumption | 212.6 | 211.52 | 212.2 | 208.4 | 210.8 | kWh/tonn |
| Water withdrawal | 353.9 | 367.98 | 350.4 | 341.5 | 345.3 | liters/tonn |
| Waste generation | 4.4 | 4.2 | 4.3 | 4.3 | 4.0 | kg per tonne |
Nutrient release
Nutrients such as phosphorus and nitrogen are essential for life and these elements occur naturally in the water column of both fresh and marine environments. In the environment they function as nutrients for algae growth.
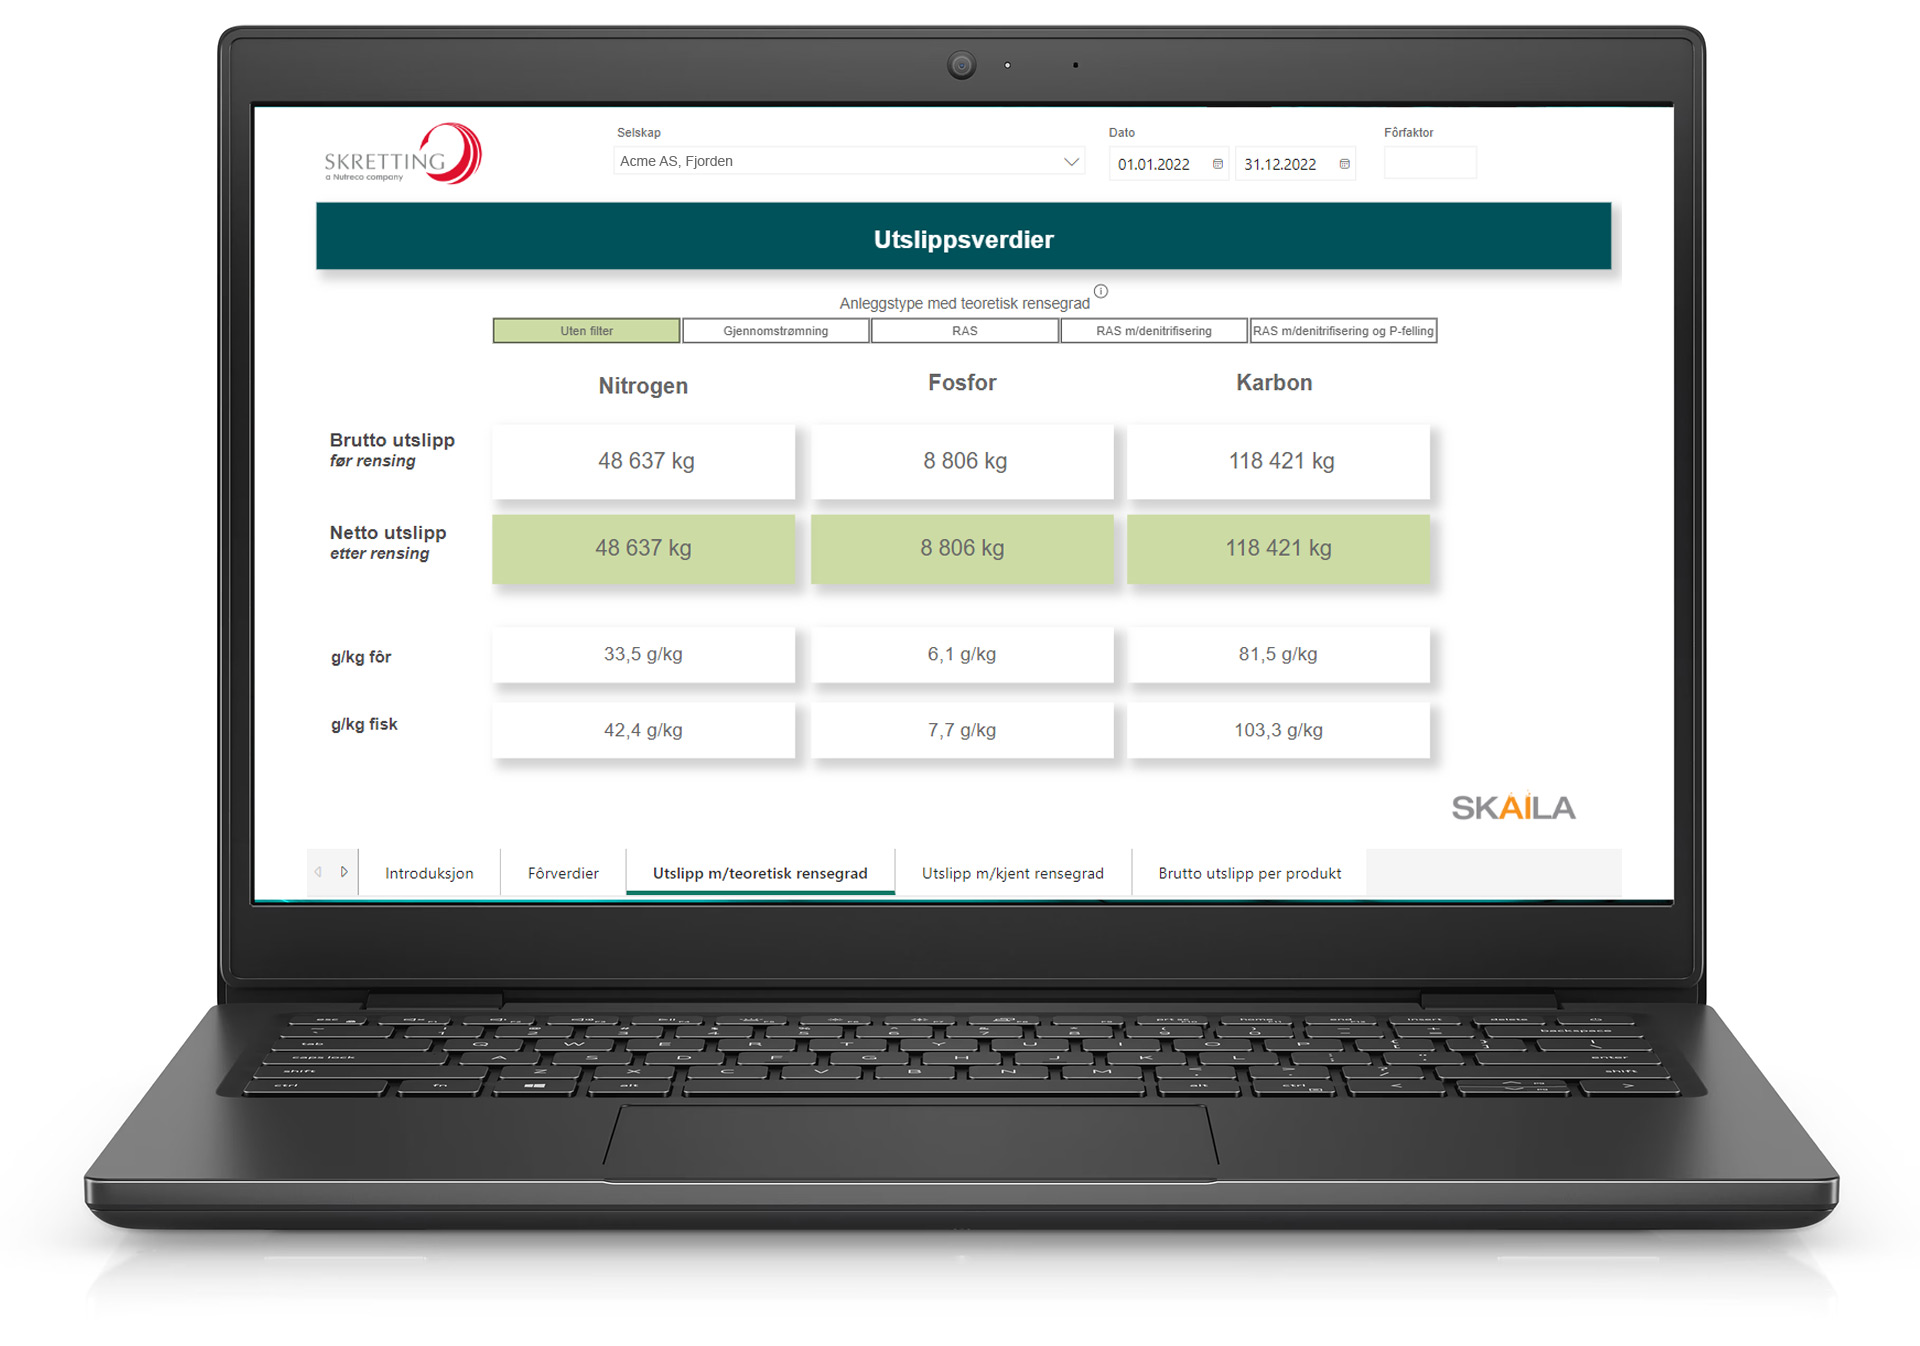
Skretting's nutrient release calculator offers data for customers, specific feeds and/or for individual fish farm locations based on the delivered feed.
Skretting has implemented a new nutrient release model that gives our customers emission values for their own feed, even for their own specific locations. We calculate emissions for nitrogen, phosphorus and carbon. The tool is avaliable on our client net.
Disclaimer
The provided carbon footprint data are based on internal calculations following the core guiding principles of the standard PEFCR Feed for Food Producing Animals (v5, 2024), but are not based on fully compliant PEFCR studies. Although Skretting has taken care to ensure that the information contained herein is as accurate as possible and up to date, Skretting does not warrant the accuracy, reliability or completeness of the information. The results themselves have not been externally verified, while the applied calculation methodology has been third party assured to be aligned with the PEFCR Feed standard. The information provided is for informational purposes only and is intended for internal business use only. The reader is solely responsible for any interpretation or use of the material contained herein. The footprint data are subject to change (e.g. due to ongoing database development or better supply chain information). Furthermore, cradle-to-gate footprint values are not allowed to be used for comparison or comparative assertions among each other or with other feed footprint data in accordance with international LCA standards. Animal feed is an intermediate product in the food production chain and the footprint attached to it only reflects part of the life cycle. Without considering feed performance/ functionality and downstream impacts, comparison is neither allowed nor meaningful.